TIMSS 2023 Longitudinal International Results in Mathematics and Science
About TIMSS 2023 Longitudinal
IEA’s TIMSS 2023 Longitudinal is the first student-level longitudinal extension of TIMSS (Trends in Mathematics and Science Study). TIMSS 2023 Longitudinal reassessed fourth- and eighth-grade students who participated in TIMSS 2023 in the fifth and ninth grades.
Since its founding in 1959, IEA has worked to advance evidence-based insights into student learning worldwide. The release of the TIMSS 2023 Longitudinal International Results in Mathematics and Science takes international large-scale assessments a step further in driving innovation. This study is particularly significant as it represents IEA’s first student-level longitudinal international large-scale assessment, assessing the same students in two grades.
The uniqueness of TIMSS 2023 Longitudinal lies in its ability to measure learning gains for the same students over the course of a year, rather than inferring them from comparisons of cohorts. By reassessing students who participated in TIMSS 2023 during the following school year (in Grades 5 and 9), the study provides evidence of how much progress students achieve in a year of schooling. This opens up new perspectives for educational effectiveness research: differences between and within countries can now be interpreted against the benchmark of a year’s learning, and contextual factors can be linked directly to growth.
For the participating education systems, TIMSS 2023 Longitudinal delivers high-quality, internationally comparable data that provide valid measures of student progress, new opportunities to understand the contexts of learning, and evidence that can inform strategies to close achievement gaps and promote equity. The study also helps participating countries build their capacity to conduct longitudinal research and apply findings to policymaking and practice.
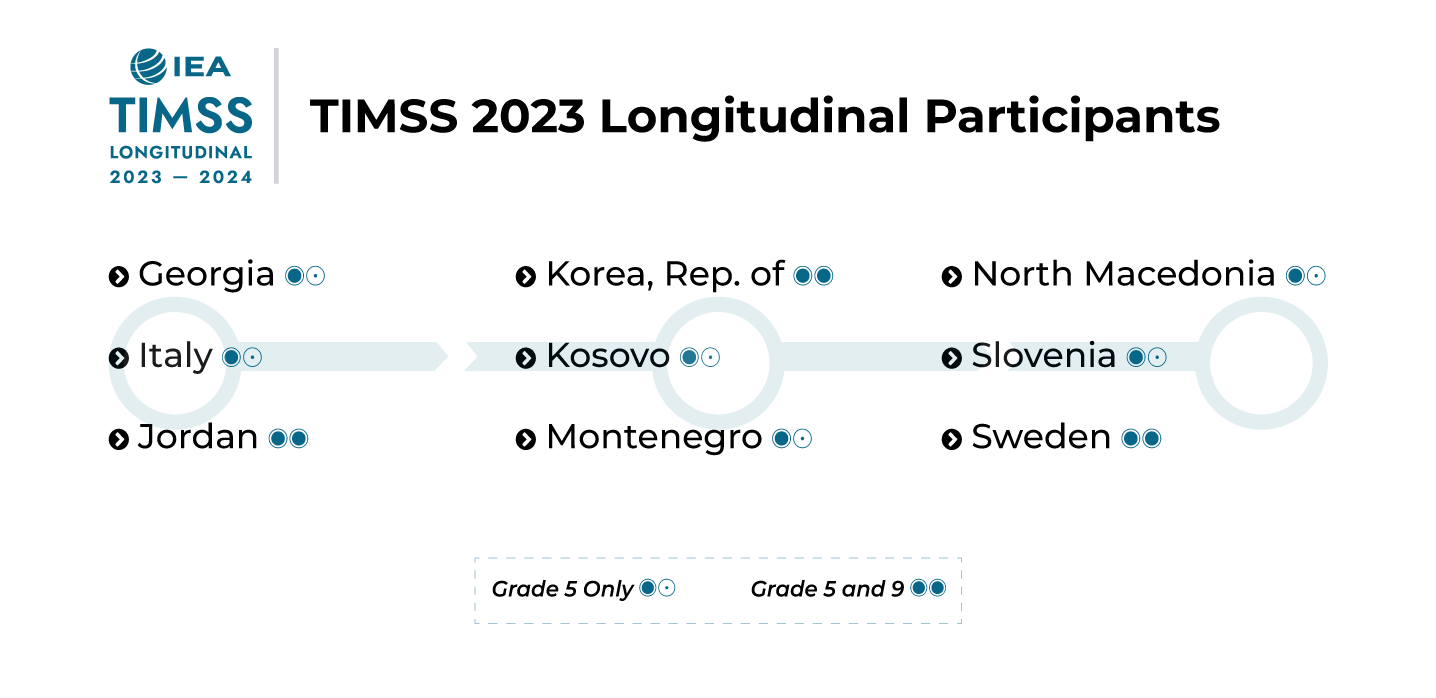
This international report was made possible by the hard work of many parties involved, and I would like to thank all the individuals who contributed to TIMSS 2023 Longitudinal. A big congratulations goes to the education systems that joined this study—Georgia, Italy, Jordan, the Republic of Korea, Kosovo, Montenegro, North Macedonia, Slovenia, and Sweden. I extend my gratitude to the TIMSS & PIRLS International Study Center at Boston College’s Lynch School of Education and Human Development for pioneering this initiative with us, together with the sampling teams at IEA-Hamburg and RTI International. This study would also not have been possible without the continued dedication of all IEA staff, the expertise of the TIMSS 2023 Longitudinal Questionnaire Item Review Committee, and the guidance of IEA’s Publications and Editorial Committee.
I extend my sincere appreciation to the Directorate-General of the European Commission responsible for EU policy on education, youth, sport, and culture, whose co-funding and generous support enabled the participation of Kosovo, Montenegro, and North Macedonia. Their involvement has not only expanded the reach of TIMSS 2023 Longitudinal but also provided further perspectives and avenues for supporting work within these education systems.
I hope that this report will inspire researchers, educators, and policymakers to embrace the longitudinal perspective in education. At the same time, it is important to recognize that longitudinal and cross-sectional assessments are complementary. Regular TIMSS cycles provide essential snapshots of achievement, allowing countries to monitor progress, set benchmarks, and compare outcomes over time. Meanwhile, TIMSS 2023 Longitudinal adds the capacity to measure individual growth between years. Together, these perspectives provide a powerful basis for guiding strategies to achieve excellence, equity, and sustained progress in mathematics and science education worldwide.
I am looking forward to many future publications that will make use of this rich database.
Dirk Hastedt
Executive Director, IEA
IEA’s TIMSS 2023 Longitudinal Study is the first longitudinal extension of TIMSS (Trends in International Mathematics and Science Study), providing data that permits researchers to examine various ways students may develop their knowledge of mathematics and science over time. The regular TIMSS cycles assess samples from the same population in different birth cohorts every four years and do not follow or reassess the same students. Countries participating in TIMSS 2023 were given the unique opportunity to participate in a student-level longitudinal study1 consisting of two data collections. The national sample assessed in TIMSS 2023 served as the first data collection for fourth- and eighth-grade students, and this was followed by another data collection at the end of Grade 5 or 9. This allowed for tracking both students’ academic growth and their contextual experiences. Nine countries2,3 participated in the longitudinal study; all participated at Grade 5 (following Grade 4 students from TIMSS 2023), and three countries additionally participated at Grade 9 (following Grade 8 students from 2023). By capturing achievement and contextual factors at two time points, TIMSS 2023 Longitudinal offers valuable insights into the dynamics of learning and academic growth, as well as the conditions that shape them.
This longitudinal data collection is built upon the foundation of TIMSS 2023, using the same assessment frameworks, the same item booklets, a group-adaptive design adjusted for expected growth, and computer-based assessment procedures. That is, the same TIMSS 2023 assessment instruments were administered to the same sample of TIMSS 2023 students the following school year, in 2024. For more information about these topics, see the TIMSS 2023 International Results. To ensure reliable and valid measurement of growth, the TIMSS & PIRLS International Study Center at Boston College refined the group adaptive assessment design to ensure students did not receive the same booklet when they were retested. Countries were successful in tracking and reassessing students between the two school years—see Appendix A for more information about the TIMSS 2023 Longitudinal Study sample.
1 Cross-sectional internationally comparable trend studies are sometimes considered longitudinal studies at the country level, however, since different students, and in most cases, different schools are sampled each time, they do not provide truly longitudinal data.
2 This designation is without prejudice to positions on status and is in line with UNSCR 1244/1999 (United Nations, 1999) and the International Court of Justice (ICJ) Opinion on the Kosovo declaration of independence (ICJ, 2010).
3 ICJ. (2010). Accordance with International Law of the Unilateral Declaration of Independence in Respect of Kosovo, Advisory Opinion, I.C.J. Reports 2010. International Court of Justice. https://www.icj-cij.org/public/files/case-related/141/141-20100722-ADV-01-00-EN.pdf
The longitudinal design allows researchers to quantify how much students advanced in their understanding of mathematics and science and whether contextual variables captured in the questionnaires related to the estimated growth of different student groups. The goal of this analysis is examining how growth varies among students from different socioeconomic backgrounds, across diverse education systems, and in relation to students’ attitudes, engagement, and experiences in school. In addition to exploring relationships with growth, the re-administration of the context questionnaires allows for the examination of stability or change over time in the context variables themselves.
The context variables included in the TIMSS 2023 Longitudinal Study are crucial as they allow researchers to examine differences in educational outcomes across student groups. For example, the data provide evidence of an association between home socioeconomic status and growth in mathematics and science over the course of an academic year. The data also show that very frequent absenteeism is detrimental to learning gains. Examining the contexts of learning and growth may reveal disparities that widen or narrow over time, across subgroups defined based on student background, or across countries. The contextual data can also be used to study whether growth patterns differ in relation to school composition or academic emphasis across and within countries. The TIMSS 2023 Longitudinal Study also allows for the exploration of the relationship between students’ attitudes and achievement—for example, whether students who achieve greater academic growth in these subjects exhibit more positive attitudes toward mathematics and science, or show a more profound sense of belonging to their school community, achieve greater academic growth in these subjects. System-level information about student transitions between the study’s focal grades and shifts in mathematics and science curricula between those grades is also available via data from the TIMSS 2023 Longitudinal Curriculum Questionnaire, which contains information provided by representatives of the participating countries.
Research in developmental psychology suggests that greater academic growth can be expected between Grades 4 and 5 than between Grades 8 and 9. Cognitive development and learning are thought to progress more rapidly during earlier stages of childhood, with foundational skills acquired in larger developmental leaps compared to the more gradual gains seen in adolescence. Case (1992)4 and Anderson (2002)5 suggest that executive function and working memory capacity increase most steeply during middle childhood, supporting faster acquisition of core academic skills such as reading comprehension and numeracy. Similarly, Cattell’s theory of fluid and crystallized intelligence suggests that fluid intelligence, which underpins problem-solving and learning capacity, grows rapidly in the early years before leveling off in adolescence.6,7
The results of TIMSS 2023 Longitudinal are largely consistent with these developmental expectations. However, students do not all grow at the same rate academically. Differences can be expected not only across countries, but also within countries. It is important to note that curricular expectations may differ across countries, and differences may exist in the proportions of children still in schools at higher grades. What is expected of students between adjacent grades can also interact with these findings. The transition between Grade 4 and 5 may be more challenging in some countries and less so in Grade 8 to 9, while in other countries, the curricula may impose more challenges when moving from Grade 8 to 9. This means that not all growth trajectories will follow the same patterns across countries. As an example, in both mathematics and science, student growth is more pronounced between Grade 4 and Grade 5 than between Grade 8 and Grade 9 in two out of three countries that participated at both grade levels, while one country showed larger growth between Grades 8 and 9 compared to the gains observed between Grade 4 and 5.
Some of the contextual variables captured in TIMSS 2023 Longitudinal, such as home resources or school institutional factors, tend to remain relatively stable over time, with minimal change between 2023 and 2024.8,9,10 In contrast, student-level variables, such as self-reported experiences, motivation, and attitudes, can have both stable elements and components shaped by situational factors, making them more susceptible to individual variability and change across school years.11,12,13 Specifically, self-reports may change over time since individuals who provide these responses are exposed to new situations and experiences both at and outside of school. A student who reports liking mathematics very much in Grade 4 may report not liking mathematics in Grade 5, and vice versa, based on changes in what is taught, who is teaching, or other factors outside of what can be collected in context questionnaires.
4 Case, R. (1992). The mind’s staircase: Exploring the conceptual underpinnings of children’s thought and knowledge. Erlbaum. https://doi.org/10.4324/9780203763186
5 Anderson, P. (2002). Assessment and development of executive function during childhood. Child Neuropsychology, 8(2), 71–82. https://doi.org/10.1076/chin.8.2.71.8724
6 Cattell, R. B. (1971). Abilities: Their structure, growth, and action. Houghton Mifflin.
7 Horn, J.L. (1982). The theory of fluid and crystallized intelligence in relation to concepts of cognitive psychology and aging in adulthood. In: Craik, F.I.M., Trehub, S. (eds) Aging and Cognitive Processes. Advances in the Study of Communication and Affect, vol 8. Springer, Boston, MA. https://doi.org/10.1007/978-1-4684-4178-9_14
8 Lowenstein AE, Wolf S, Gershoff ET, Sexton HR, Raver CC, Aber JL. (2015). The stability of elementary school contexts from kindergarten to third grade. Journal of School Psychology, 53(4):323-35. https://doi.org/10.1016/j.jsp.2015.05.002
9 Soto‑Calvo, E., Simmons, F. R., Adams, A. M., Francis, H. N., Patel, H., & Giofrè, D. (2020). Identifying the preschool home learning experiences that predict early number skills: Evidence from a longitudinal study. Early Childhood Research Quarterly, 53, 314–328. https://doi.org/10.48550/arXiv.2201.00051
10 Schmitt SA, Simpson AM, Friend M. A (2011). Longitudinal assessment of the home literacy environment and early language. Infant Child Development, 20(6):409-431. https://doi.org/10.1002/icd.733
11 Schmitt, M., & Baumert, A. (2010). On the diversity of dynamic person-situation interactions. European Journal of Personality, 24, 497–500.
12 Geiser, C., Götz, T., Preckel, F., & Freund, P.A. (2017). States and Traits: Theories, Models, and Assessment. European Journal of Psychological Assessment, 33(4), 219–223. https://doi.org/10.1027/1015-5759/a000413
13 Steyer, R., Ferring, D., & Schmitt, M. J. (1992). States and traits in psychological assessment. European Journal of Psychological Assessment, 8, 79–98.
Not only does the TIMSS 2023 Longitudinal Study provide internationally comparable data on educational achievement gains but also presents a unique opportunity to examine distributions of educational achievement in groups of students defined by contexts of learning and context changes over one school year. Beyond the descriptive findings presented in the TIMSS 2023 Longitudinal International Results, participating countries can use these findings to identify potential areas of concern within their education systems, such as variations in achievement linked to home resources of instruction-related contexts, or associations between student engagement and learning outcomes.
The study’s rigorous methodology ensures the data are reliable and valid, and comparable over the time points and are reported on the TIMSS trend scale established in 1995. The TIMSS 2023 Longitudinal dataset is a key resource for informing discussions about educational equity and quality improvement worldwide. Its robust design supports evidence-based analysis and can be used to identify areas for additional collection of evidence related to factors affecting student learning over time.
The TIMSS 2023 Longitudinal International Results report is web-based and presents the international findings from the study in an interactive format. The report is organized to highlight student growth patterns and their relationship with contextual factors. Individual sections present data on overall gains in mathematics and science achievement across participating education systems, as well as variation in achievement changes by student background, attitudes, and school environment.
The focus of this report is on the distributions of growth in student achievement both within and across countries. Central to the understanding of the data is that even within groups defined by contexts of learning, students vary in their initial level of achievement as well as in the amount of growth they show. Therefore, this report focuses on describing patterns of growth and how they compare relative to the variability of achievement changes overall.
This report employs null hypothesis significance testing sparingly, as significance tests are most useful when evaluating specific research hypotheses, not as default tools for exploratory analysis. In exploratory analysis, null hypothesis significance testing can be prone to overuse and may invite untenable interpretations.14,15,16 The descriptive statistics in this report are accompanied by measures of uncertainty (standard errors of estimation), allowing researchers to conduct their own tests if interested in comparing specific means differences or other statistics. Given the complexity of the longitudinal study data, the report focuses on describing general patterns—such as variations in achievement gains across groups or countries—rather than testing every possible comparison of means or percentages.
Descriptions of general patterns in the data are provided if they can be observed. For example, whether the gains seen over a year are similar across specific groups of interest (defined based on contexts of learning) in all participating countries, or whether effects differ and have no common direction.
Within the report exhibits, changes in mathematics or science achievement between 2023 and 2024 are labeled as “growth.” This terminology is appropriate for the majority of findings presented in the report; there are very few cases where achievement scores for groups of students, on average, decline between the two years. Such cases are clearly noted in the report text accompanying the exhibits. The term “change” is used when describing a distribution of changes in achievement between the two assessment years, rather than an estimate of a group average.
In light of the potentially complex relationships between student achievement, growth, and contextual factors, several sections employ tailored approaches to present different types of contextual data. In three context sections of this report (Home Environment, School Environment, and Student Experiences and Attitudes), exhibits are presented in a two-part structure. Part A of each exhibit shows the distribution of students across the contextual variable categories in a single year in conjunction with student growth in mathematics or science, whereas Part B shows the distribution of students across the contextual variable categories for both years and the associated average achievement in mathematics or science for each year. The Home and School Environment sections of this report show contextual data from the study’s first time point (2023 – Grade 4 or 8) in conjunction with growth. The 2023 measures were selected for this purpose because relatively small changes in home and institutional factors across the two years can be expected. In contrast, the Student Experiences and Attitudes section of the report uses contextual data from the study’s second time point (2024 – Grade 5 or 9) when examining student growth in mathematics or science. Unlike home and school factors, student-level factors have been observed to vary notably between years at the individual level, suggesting that recent self-reports are more accurate for capturing associations with growth in achievement in that year. The differing approach for each report section ensures that contextual analyses align with the growth period being studied.
The remaining context section of the report (Classroom Environment) does not use the two-part structure. Rather, exhibits in this section follow the format of the Part B exhibits described above, showing the distribution of students within the contextual categories for both assessment years and associated achievement in mathematics or science. The nature of the contextual variables in this report section (e.g., teachers’ majors, instructional clarity, or disorderly classroom behavior) makes it challenging to determine the appropriate contextual data for evaluating their relationship with growth in achievement. For example, students’ growth in mathematics between Grades 4 and 5 cannot be straightforwardly related to the major of either their Grade 4 or Grade 5 mathematics teacher, nor the classroom environment from either individual year. However, the distribution of students across reporting categories, the relationships between contextual variables and average achievement, and changes in student distributions over time can still provide valuable information.
Lastly, it is important to note that selected contextual data related to students’ attitudes toward science of experience in science classes are presented for Grades 4 and 5 only. This is because of different organization for science instruction across the three countries participating in Grades 8 and 9, which has implications for the questionnaires students received. One country (Korea) had integrated science classes at both grade levels, one country (Jordan) had integrated science classes in Grade 8 and separate science subject classes in Grade 9, and one country (Sweden) had separate science subject classes in both grades. Any discussions of these data across the two time points are country-specific by necessity and so are not presented in this report. However, all data are available in the TIMSS 2023 Longitudinal International Database.
14 Berkson, J. (1938). Some difficulties of interpretation encountered in the application of the chi-square test. Journal of the American Statistical Association 33(203) 526–536.
15 Cohen, J. (1994). The earth is round (p < .05). American Psychologist 49, 997–1003. https://psycnet.apa.org/doi/10.1037/0003-066X.49.12.997
16 Gigerenzer, G. (2004). Mindless statistics. The Journal of Socio-Economics 33, 587–606. https://doi.org/10.1016/j.socec.2004.09.033
The TIMSS 2023 Longitudinal Study adhered to the same quality assurance protocols established for TIMSS 2023, ensuring its longitudinal data’s integrity, comparability, and reliability. All participating countries followed internationally standardized procedures for data collection, including thorough training of assessment administrators, rigorous monitoring of testing conditions, and systematic verification of data accuracy. To minimize attrition and maintain the representativeness of the longitudinal cohort, the TIMSS 2023 Longitudinal sampling team worked closely with national centers to track students across the one-year interval. This involved careful planning to secure continued school participation and address logistical challenges in recontacting students, particularly those transitioning between schools. Countries received targeted technical support to ensure that the original samples of fourth- and eighth-grade students could be reliably followed, ensuring the study’s ability to analyze growth over time.
A cornerstone of the assessment design was the careful assignment of test booklets to avoid memory effects and ensure valid measurement of student progress. While the same pool of TIMSS 2023 booklets was used in the 2024 assessment, each student received a different booklet in 2024 than the one they had completed in 2023. This approach eliminated the risk of prior exposure influencing performance, safeguarding the authenticity of longitudinal growth estimates. The implemented longitudinal adaptive design aligns with students’ advancing grade levels and selected slightly more challenging booklets from the existing TIMSS booklets for the 2024 assessment. For example, fourth graders in 2023, now in fifth grade, received booklets reflecting the expected progression in mathematics and science curricula, while eighth graders in 2023, now in ninth grade, were administered booklets appropriate to their higher grade level.
Finally, the analyses of the TIMSS 2023 Longitudinal data were conducted using the same rigorous methods and applied the same quality standards as those applied in TIMSS 2023, drawing strength from the evidence collected in the 2023 cycle of TIMSS, based on more than 650,000 students. This enables the reporting of longitudinal results on the same scale as the most recent trend data from TIMSS 2023.
Through these methodological safeguards—coupled with the expertise of national teams to ensure fidelity in implementation—the TIMSS Longitudinal 2023 study delivers a high-quality, internationally comparable dataset. The careful adherence to quality standards and the design features implemented to remove confounding factors such as memory effects or sample attrition, empowering stakeholders to analyze student growth with confidence and derive actionable insights into the drivers of learning in mathematics and science. Further details about operational and analysis procedures are available in the TIMSS 2023 Longitudinal Technical Report.
Achievement Results in Mathematics and Science
Contextual Data for Learning Mathematics and Science
Suggested Citation
von Davier, M., Kennedy, A. M., Reynolds, K. A., Gonzalez, E., & Khorramdel, L. (2025). TIMSS 2023 Longitudinal International Results in Mathematics and Science. Boston College, TIMSS & PIRLS International Study Center. https://doi.org
Co-funded by the European Union. Views and opinions expressed are however those of the author(s) only and do not necessarily reflect those of the European Union or the European Education and Culture Executive Agency (EACEA). Neither the European Union nor EACEA can be held responsible for them.