Student Bullying
Classroom Environment
Instructional Clarity in Science Lessons
Reports of experiencing high-clarity instruction is generally associated with higher average science achievement for fourth- and eighth-grade students. The TIMSS 2023 Instructional Clarity in Science Lessons scale (Exhibit 5.3.1) includes items that asked students to indicate their level of agreement with different statements about their teachers’ science instruction. In countries where eighth-grade science is taught as separate subjects, students indicated their level of agreement for each science course in which they were enrolled (biology, chemistry, physics, earth science). Students were grouped into three categories based on their combined reports of the level of instructional clarity of their teachers: “high clarity of instruction,” “moderate clarity of instruction,” and “low clarity of instruction.”
On average, 68 percent of fourth-grade students internationally reported “high clarity” of instruction in their science lessons, 26 percent reported “moderate clarity,” and just 6 percent characterized their lessons as having “low clarity.” On average, internationally and within most countries, higher clarity was associated with higher average science achievement for fourth-grade students (Exhibit 5.3.2). Across countries, the average achievement was 505 among students reporting “high clarity” of instruction, 483 among students reporting “moderate clarity” of instruction, and 471 among students reporting “low clarity” of instruction.
Eighth-grade students’ reports are presented separately for countries where science is taught as an integrated subject in eighth grade (Exhibit 5.3.3a) and for countries in which science is taught as separate subjects (Exhibits 5.3.3b to 5.3.3e). In integrated science, about half of the students (51%) reported “high” instructional clarity, 35 percent reported “moderate” instructional clarity, and 14 percent reported “low” instructional clarity, on average. Generally, similar percentages of students reported “high,” “moderate,” and “low” instructional clarity for the separate science subjects of biology, chemistry, physics, and earth science. For these separate science subjects, 46 to 49 percent of eighth-grade students, on average, characterized instruction as having “high clarity,” 36 to 37 percent reported “moderate clarity,” and 14 to 18 percent reported “low clarity.” On average, internationally and within most countries, reporting greater instructional clarity was associated with higher average science achievement for eighth-grade students (Exhibit 5.3.3a to 5.3.3e). In integrated science, students who reported experiencing “high” instructional clarity had an average achievement of 496, students who reported experiencing “moderate” instructional clarity had an average achievement of 477, and students who reported experiencing “low” instructional clarity had an average achievement of 462. Average achievement differences follow the same general pattern but are less pronounced in the separate science subjects. Students who reported experiencing “high” instructional clarity had the highest average science achievement (ranging from 458 to 473 across subjects), but there were very small or no differences in average achievement between students who reported experiencing “moderate” or “low” instructional clarity (average achievement ranged from 448 to 456 and 448 to 453, respectively).
Read More
Instructional Clarity in Science Lessons
Science Grade 4
Never or Almost Never
About Monthly
About Weekly
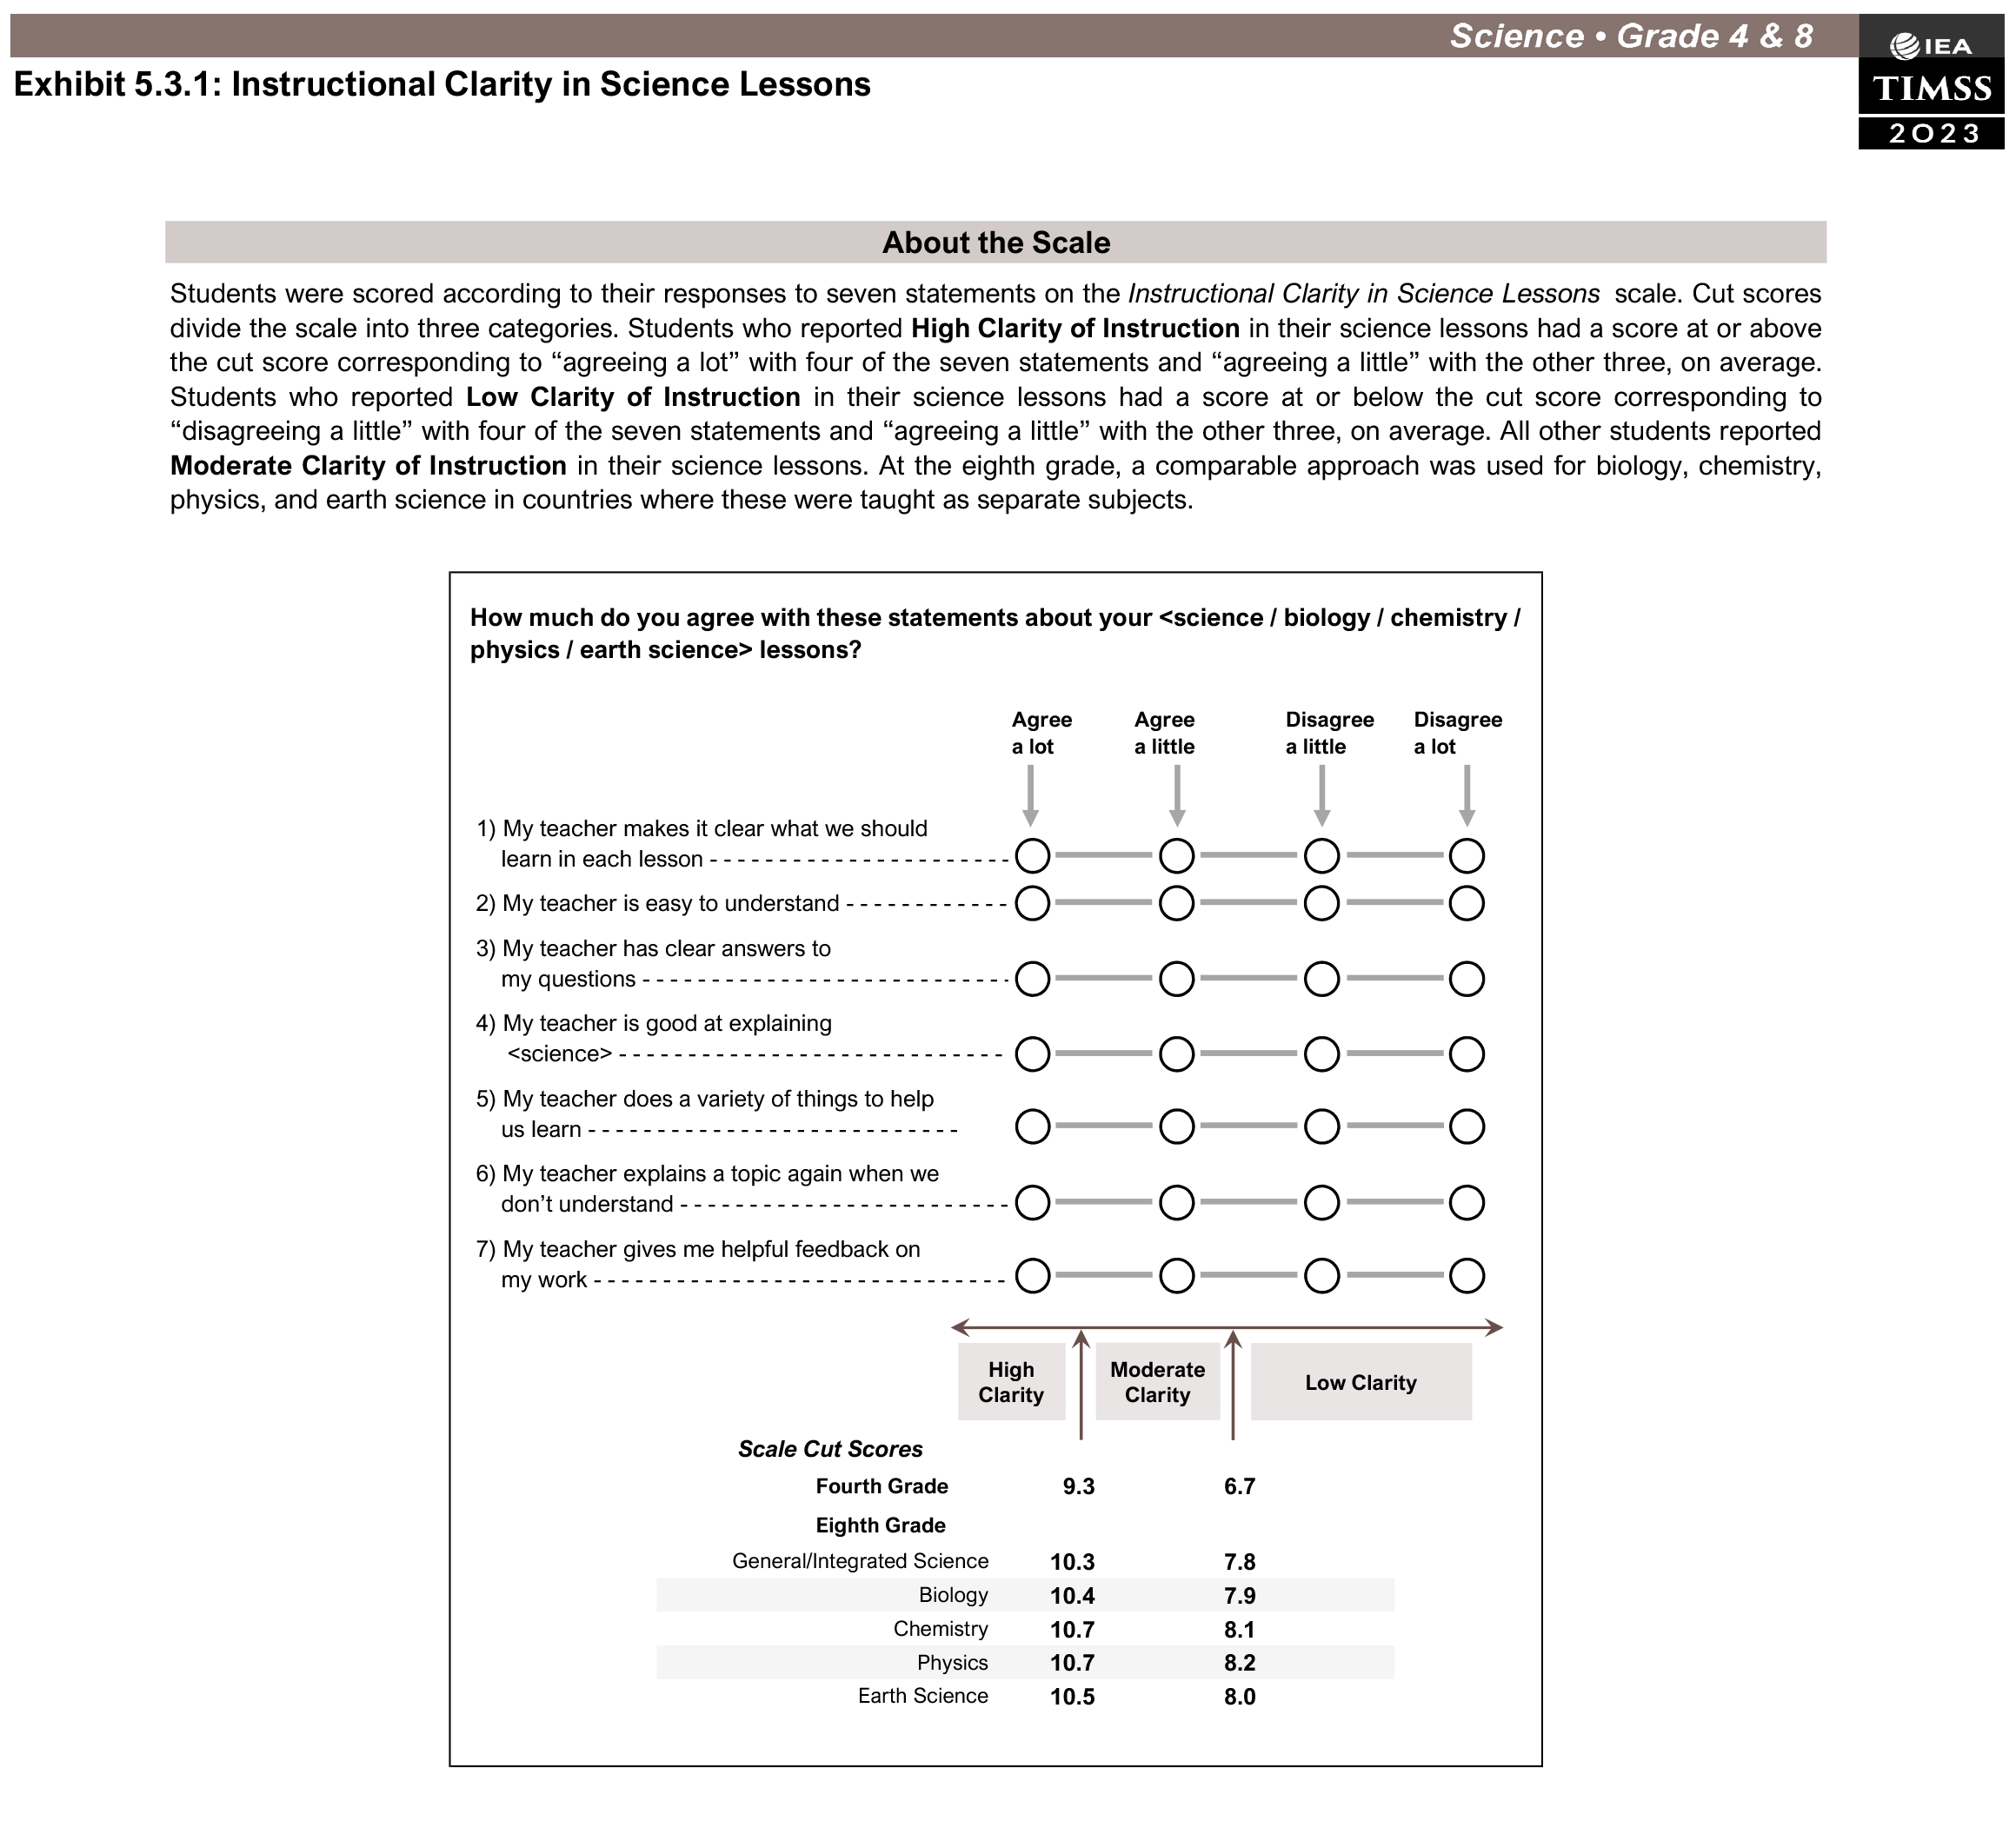
This TIMSS context questionnaire scale was established in 2023 based on the combined response distribution of countries that participated in TIMSS 2023. To provide a point of reference for country comparisons, the scale centerpoint of 10 was located at the mean of the combined distribution. The units of the scale were chosen so that 2 scale score points corresponded to the standard deviation of the distribution. The separate scales for biology, chemistry, physics, and earth science were each established in 2023 using a comparable approach.
( ) Standard errors appear in parentheses. Because of rounding some results may appear inconsistent.
An “r” indicates data are available for at least 70% but less than 85% of the students.
An “s” indicates data are available for at least 50% but less than 70% of the students.
An “x” indicates data are available for at least 40% but less than 50% of the students—interpret with caution.
A “y” indicates data are available for less than 40% of the students.
A dash (-) indicates comparable data not available.
A tilde (~) indicates insufficient data to report result.
Average achievement in exhibits 5.3.3a – 5.3.3e is overall science achievement.
Scroll Up