Science Experiments Frequency
Classroom Environment
Frequency Students Conduct Experiments in Science Lessons
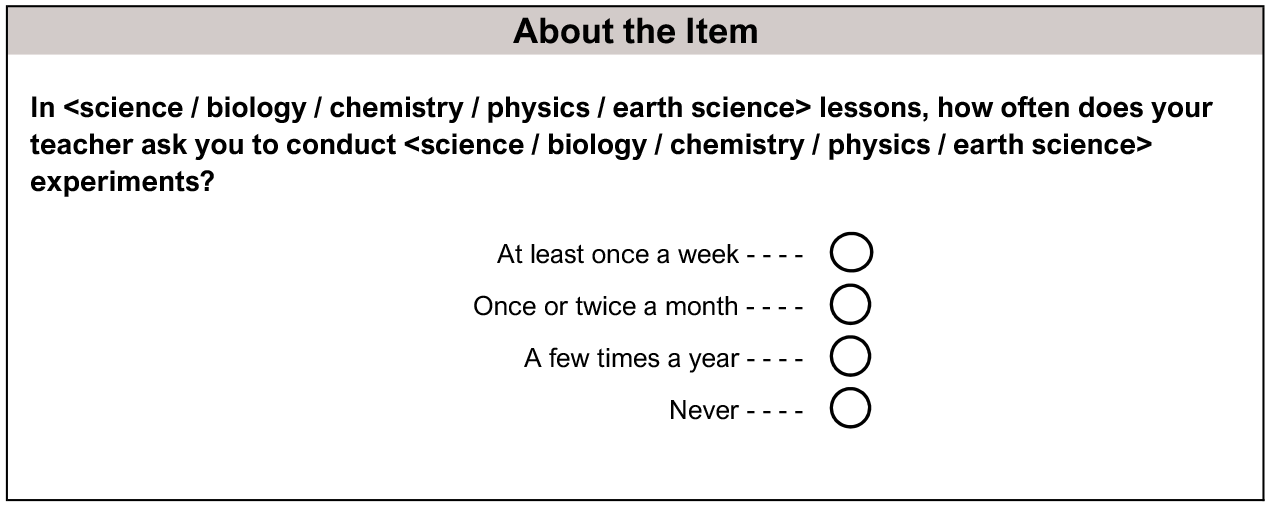
The reported frequency of conducting experiments in science lessons does not have a linear relationship with average science achievement for fourth- or eighth-grade students. Students who reported conducting occasional experiments had higher average science achievement than those who reported conducting experiments more frequently or not at all. Students in both grades were asked to report how often they conducted science experiments in their science lessons (Exhibit 5.3.11). Students could respond “at least once a week,” “once or twice a month,” “a few times a year,” or “never.” In countries where eighth-grade students study separate science subjects, students responded to the item for each subject in which they were enrolled (biology, chemistry, physics, earth science).
In fourth grade, 31 percent of students reported that they conducted experiments “at least once a week,” 28 percent “once or twice a month,” 25 percent “a few times a year,” and 15 percent “never,” on average (Exhibit 5.3.12). There is variation in these percentages across countries. Eight countries have more than 50 percent of fourth-grade students reporting that they conduct experiments “at least once a week,” while 23 countries have less than 25 percent of students in this category. Internationally, fourth-grade students who reported doing experiments “once or twice a month” or “a few times a year” had higher average science achievement than students who reported doing experiments “at least once a week” or “never” (500 and 506 vs. 477 and 485, respectively).
In eighth grade, students’ reported frequencies of conducting science experiments varied across science subjects (Exhibits 5.3.13a to 5.3.13e). In countries teaching science as an integrated subject, 26 percent of students reported that they conducted experiments “at least once a week,” 38 percent “once or twice a month,” 24 percent “a few times a year,” and 11 percent reported they “never” conducted experiments, on average. Four countries had more than 40 percent of eighth-grade integrated science students reporting that they do experiments “at least once a week” and four countries had fewer than 10 percent of students who reported this. In countries teaching science as separate subjects, on average, students reported conducting experiments more frequently in chemistry and physics lessons and less frequently in biology and earth science lessons. The percent of students internationally who reported conducting experiments “at least once a week” was highest in chemistry and physics (32 and 31 percent, respectively), while earth science and biology had the highest percentages of students “never” conducting experiments (34 and 23 percent, respectively). In general, across the science subjects internationally, students who reported conducting experiments “once or twice a month” had higher average science achievement than those who reported conducting experiments “at least once a week” or “never.” However, in earth science students who reported “never” conducting experiments had higher average science achievement than those who reported doing so “once or twice a month.”
Read More
Frequency Students Conduct Experiments in Science Lessons
Science Grade 4

Few or No Lessons
Some Lessons
Most Lessons
( ) Standard errors appear in parentheses. Because of rounding some results may appear inconsistent.
An “r” indicates data are available for at least 70% but less than 85% of the students.
An “x” indicates data are available for at least 40% but less than 50% of the students—interpret with caution.
A “y” indicates data are available for less than 40% of the students.
A dash (-) indicates comparable data not available.
A tilde (~) indicates insufficient data to report result.
Average achievement in exhibits 5.3.13a – 5.3.13e is overall science achievement.
Scroll Up