School Discipline – Principals’ Reports
School Environment
School Discipline
Attending schools with fewer discipline and safety problems is associated with higher average achievement in mathematics and science in both fourth and eighth grades internationally. The TIMSS 2023 School Discipline scale (Exhibit 4.2.6) includes items that asked school principals to report their perceptions about the degree to which various behaviors are problems among fourth- and eighth-grade students in their school. There were slight differences in this list of problems across grades. Based on their principals’ responses, students were classified as attending schools with “hardly any problems,” “minor problems,” or “moderate to severe problems.” In both grades, there is considerable variation in these categories across countries– especially in the percentages of students classified as attending schools with “moderate to severe problems.” In the fourth grade, 11 countries have less than 3 percent of students classified in this category, while eight countries have 20 percent of students or more classified in this category. A similar pattern emerges in eighth grade (6 countries and 8 countries, respectively).
On average internationally, the majority of fourth-grade students (58%) attended schools with “hardly any problems,” and 32 percent attended schools with “minor problems.” Only 10 percent of students, on average, attended schools for which principals reported “moderate to severe problems” with discipline and safety. Average achievement in both mathematics and science was higher internationally for fourth-grade students in schools with “hardly any problems” than for students in schools with “minor problems” or “moderate to severe problems.” As shown in Exhibit 4.2.7, average mathematics achievement for students in schools with “hardly any problems” was 13 points higher than those in schools with “minor problems” and 35 points higher than those in schools with “moderate to severe problems” (510 vs. 497 and 475, respectively). The results are similar for fourth-grade science (Exhibit 4.2.8). Students in schools with “hardly any problems” with discipline and safety had the highest average science achievement (502), while the average achievement of students in schools with “minor problems” was 14 points lower (488). Internationally, students in schools with “moderate to severe problems” had average science achievement 37 points lower (465) than students in schools with only “hardly any problems.”
Less than half of eighth-grade students internationally attended schools with “hardly any problems” (41%). Forty-five percent of eighth-grade students attended schools with “minor problems” and 14% attended schools with “moderate to severe problems.” The 14 percent of eighth-grade students in the “moderate to severe problems” category had the lowest average achievement in both mathematics and science (Exhibits 4.2.9 and 4.2.10, respectively). In mathematics, there was a 42-point difference in average achievement between students in schools with “hardly any problems” and those in schools with “moderate to severe problems” (485 vs. 443). There was a 41-point difference in average science achievement for students in these two groups (483 vs. 442). Average achievement for students in schools with “minor problems” was in between these extremes for both subjects (468 in mathematics and 466 in science).
Read More
School Discipline – Principals’ Reports

Very Little
Some
A Lot
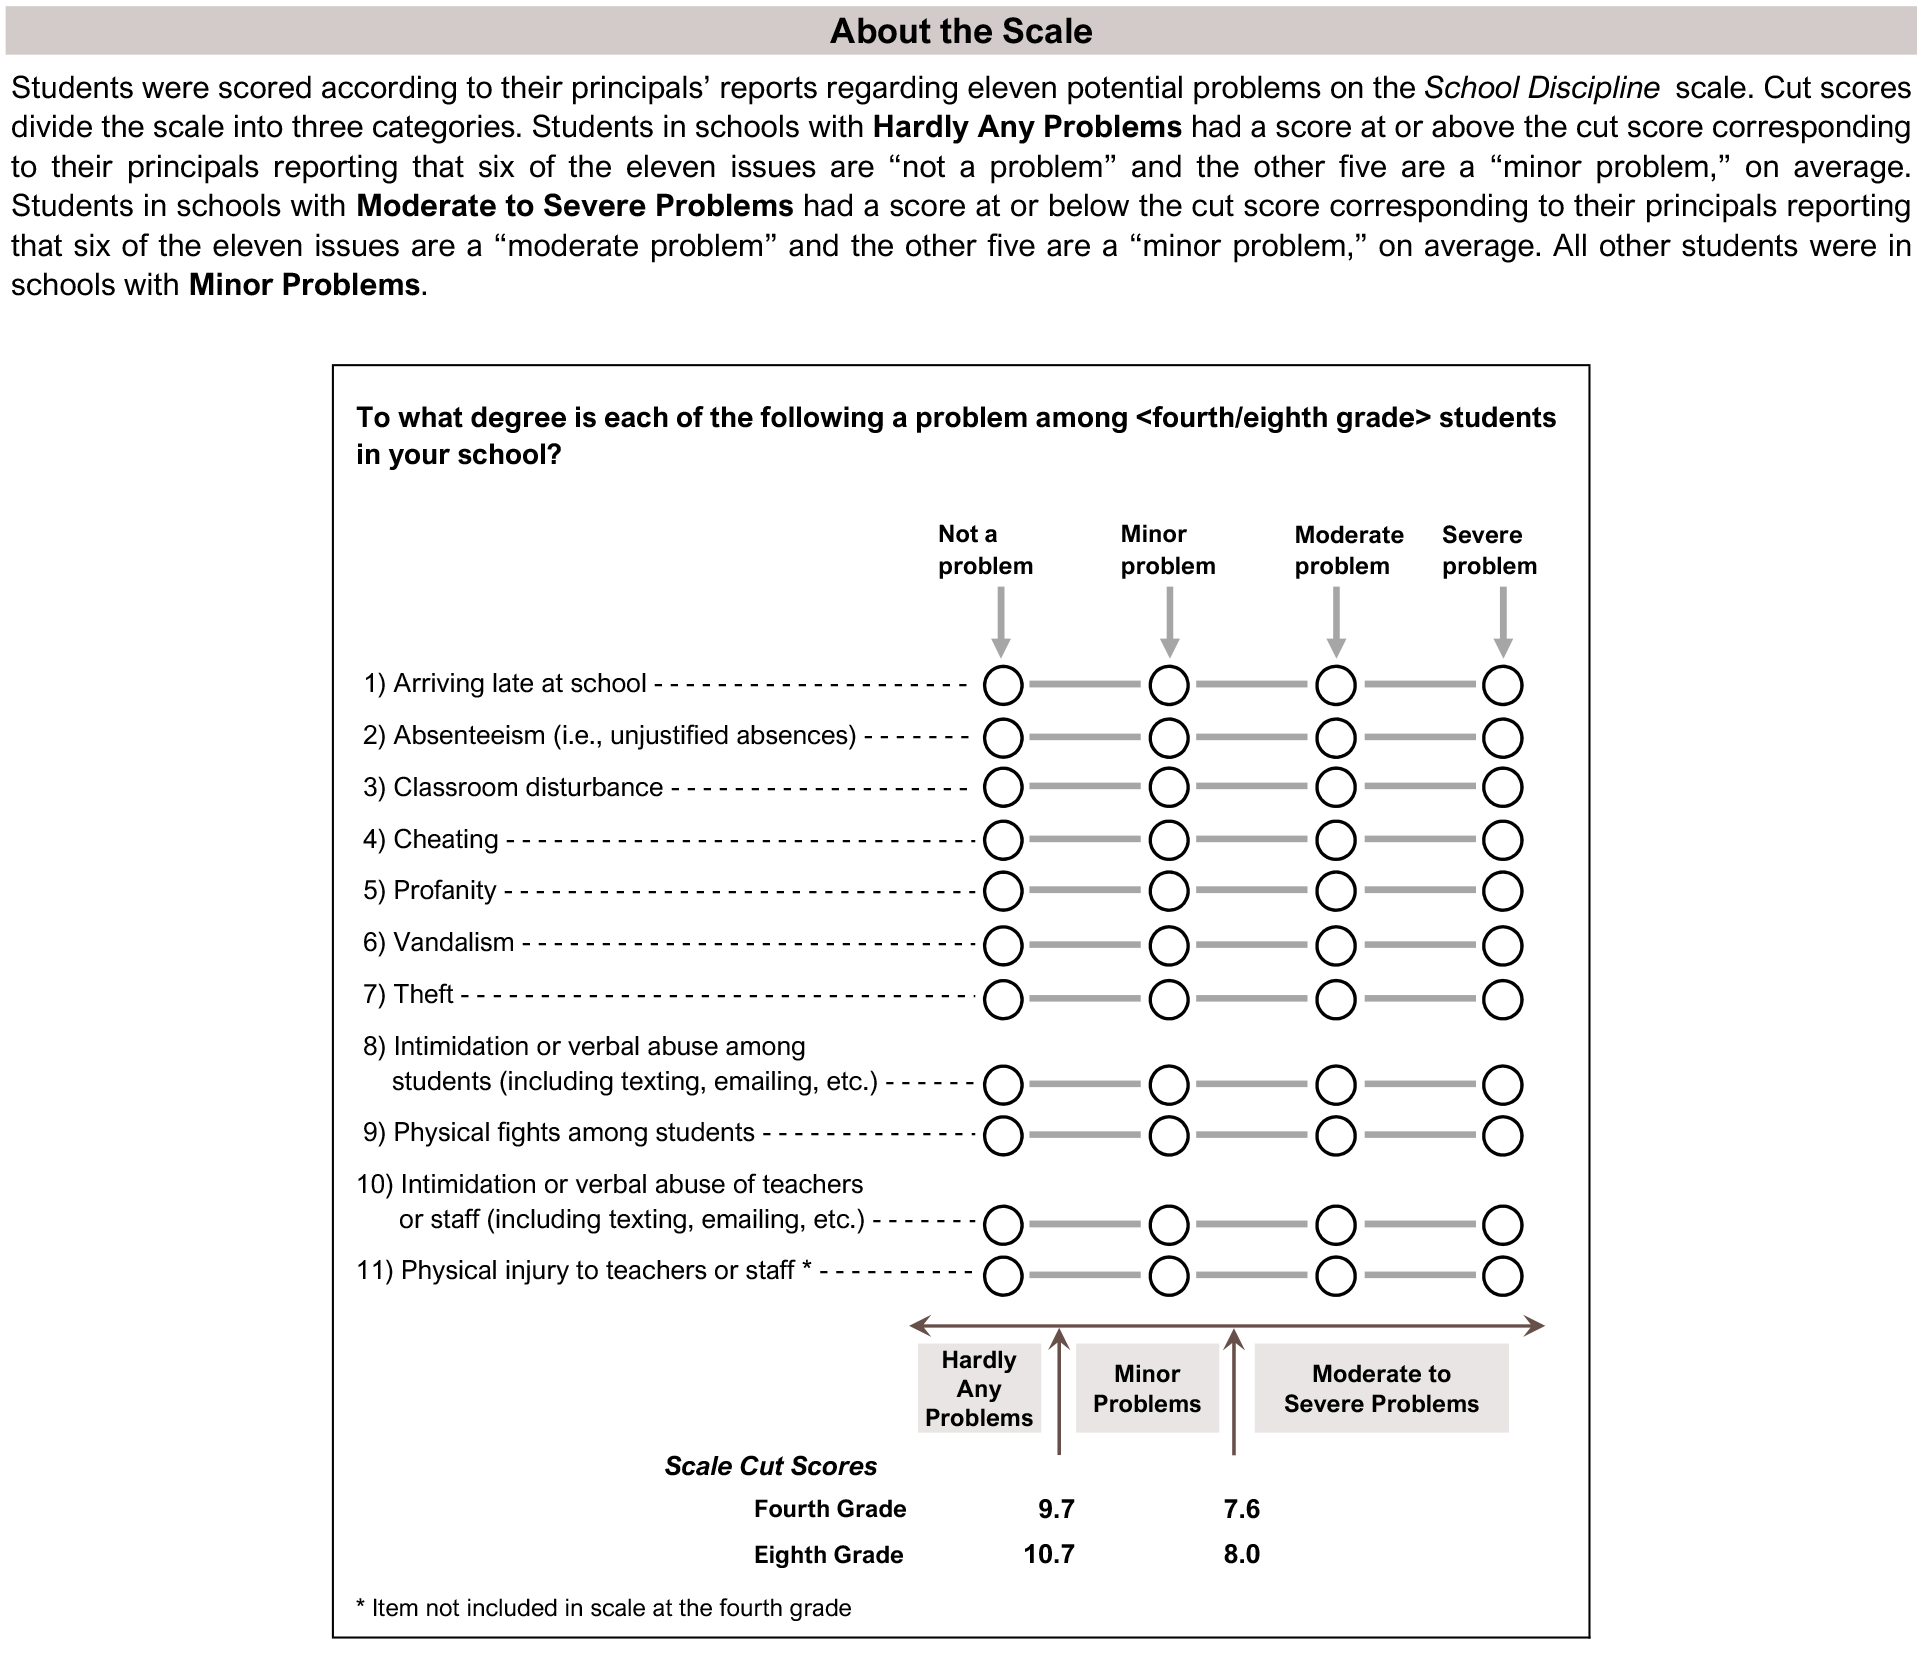
This TIMSS context questionnaire scale was established in 2011 based on the combined response distribution of countries that participated in TIMSS 2011. To provide a point of reference for country comparisons, the scale centerpoint of 10 was located at the mean of the combined distribution. The units of the scale were chosen so that 2 scale score points corresponded to the standard deviation of the distribution.
( ) Standard errors appear in parentheses. Because of rounding some results may appear inconsistent.
An “r” indicates data are available for at least 70% but less than 85% of the students.
An “s” indicates data are available for at least 50% but less than 70% of the students.
A tilde (~) indicates insufficient data to report result.
Scroll Up