Safe and Orderly School – Teachers’ Reports
School Environment
Safe and Orderly School
Attending schools that teachers perceive as safe and orderly is associated with higher achievement in both grades and subjects. The TIMSS 2023 Safe and Orderly School scale (Exhibit 4.2.11) includes items that asked teachers of students in both the fourth and eighth grade about the degree to which they agreed with statements regarding safety and discipline within the school. Based on their teachers’ responses, students were categorized as being in “very safe and orderly” schools, “somewhat safe and orderly” schools, or “less than safe and orderly” schools.
Across countries, on average, approximately half of fourth-grade students (52%) attended schools judged by their teachers to be “very safe and orderly,” with almost all of the remaining students (44%) in schools perceived by teachers to be “somewhat safe and orderly.” The small remainder of fourth-grade students (4%) attended schools perceived as “less than safe and orderly.” Fourth-grade students in schools that teachers perceived as “very safe and orderly” had modestly higher average achievement in mathematics and science compared to students in the other two classifications (Exhibit 4.2.12 and 4.2.13, respectively). Internationally, on average, fourth-grade students attending “very safe and orderly” schools as reported by their teachers had an average mathematics achievement of 509 and an average science achievement of 501. The small number of students in “less than safe and orderly” schools had the lowest average achievement (489 in mathematics and 488 in science). Average achievement for fourth-grade students in “somewhat safe and orderly” schools was in between (500 in mathematics and 489 in science).
Less than half of eighth-grade students internationally were in “very safe and orderly” schools– 43% on average across countries. Most remaining eighth-grade students were in schools that teachers reported to be “somewhat safe and orderly” (50% on average across countries) and only 7 percent were in “less than safe and orderly” schools. There was a positive relationship between teachers’ reports of school safety and average mathematics and science achievement in the eighth grade (Exhibits 4.2.14 and 4.2.15, respectively). Eighth-grade students in “very safe and orderly” schools had the highest average achievement in both subjects (484 in mathematics and 488 in science), followed by those in “somewhat safe and orderly” schools (468 in mathematics and 474 in science), and finally, the small percentage of students in “less than safe and orderly” schools (464 in mathematics and 467 in science).
Read More
Safe and Orderly School – Teachers’ Reports

Very Little
Some
A Lot
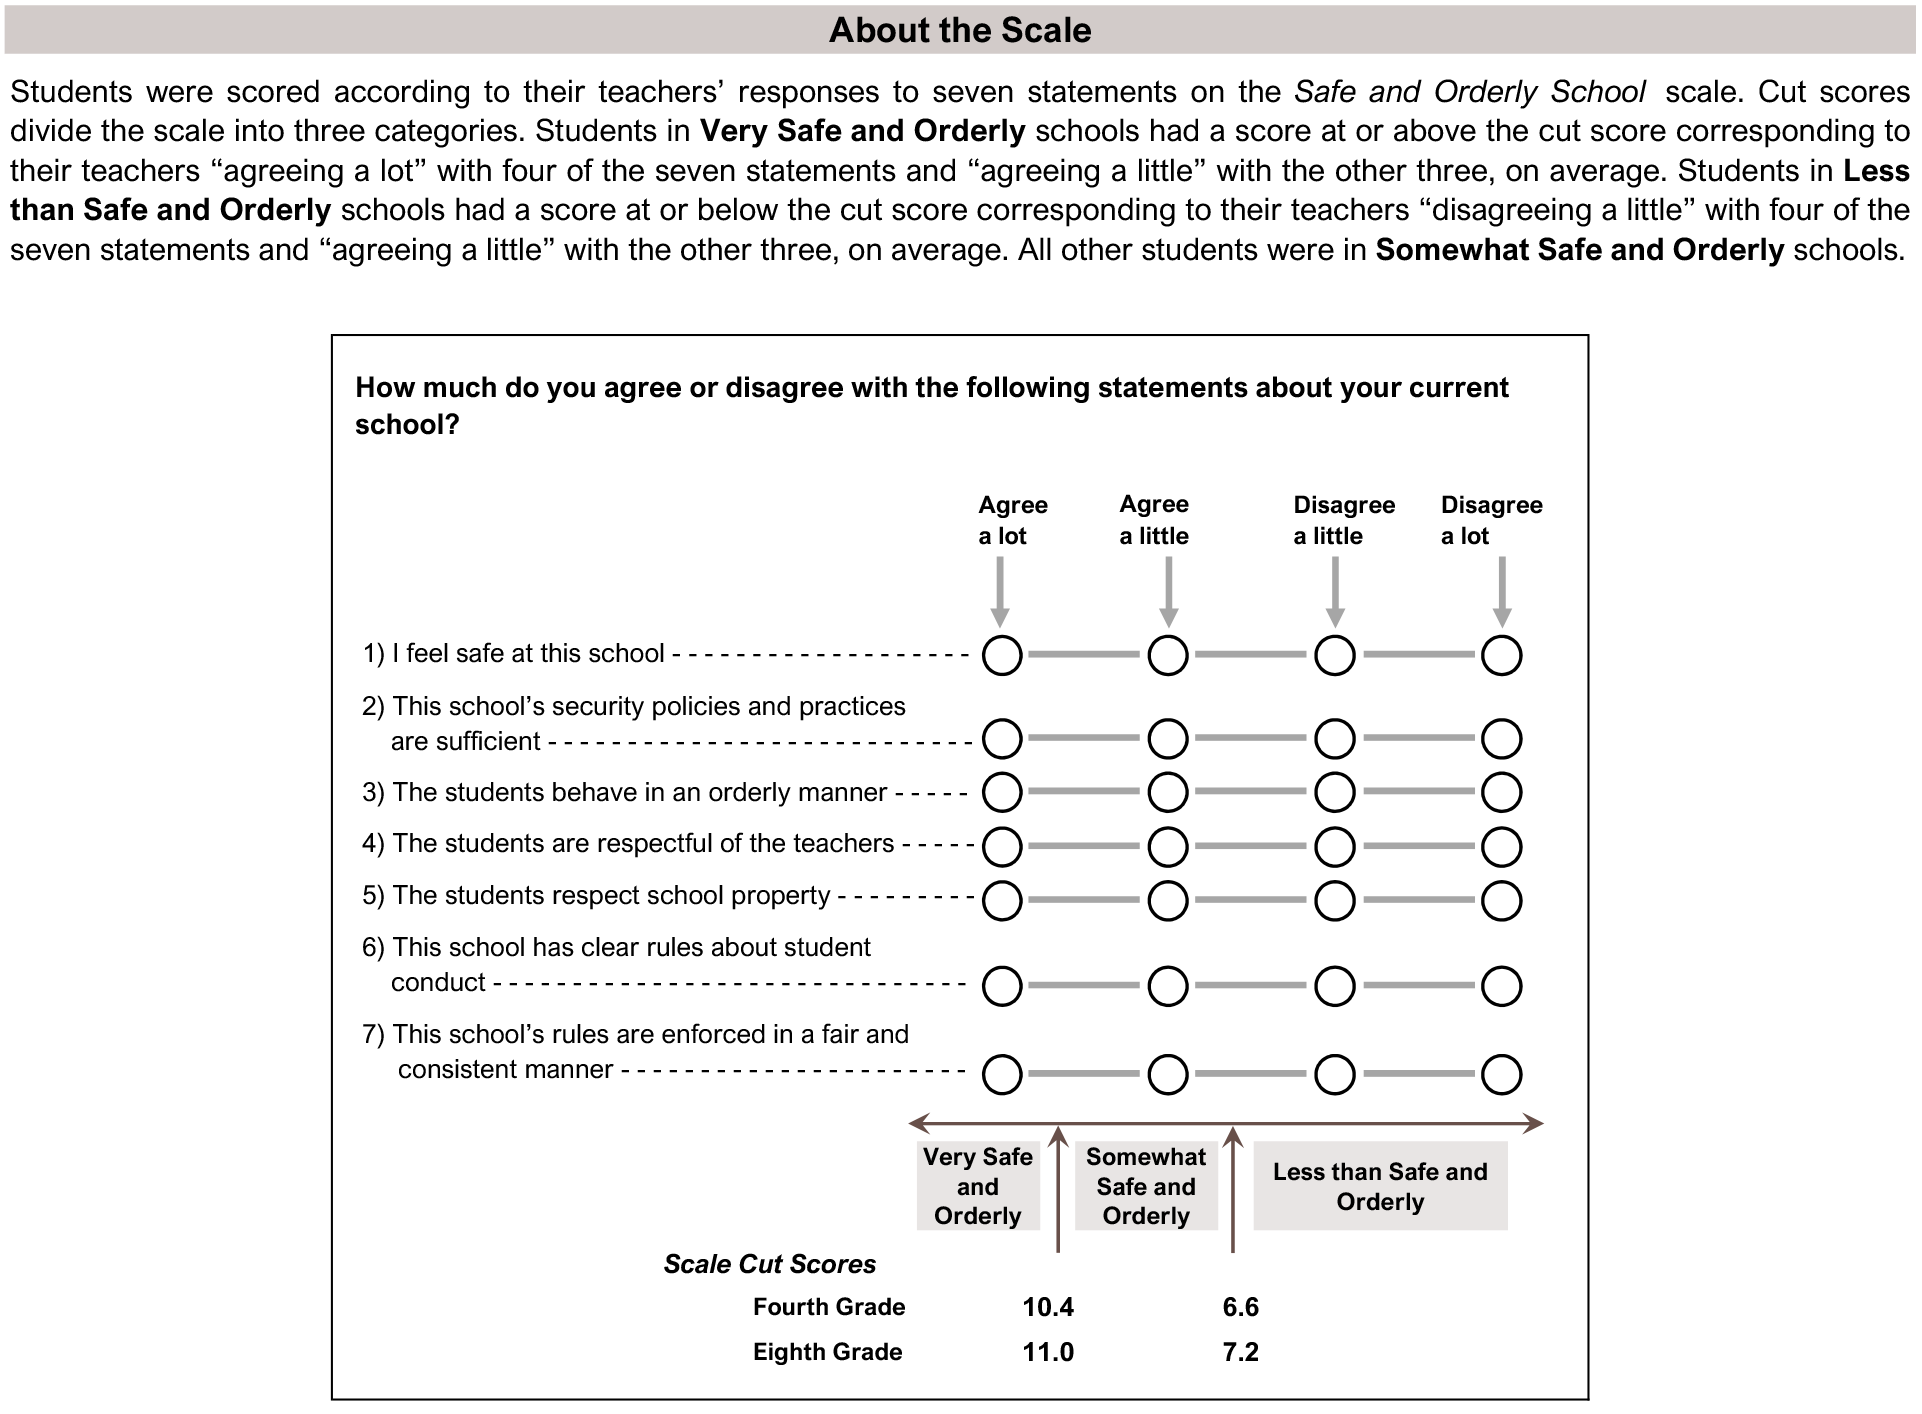
This TIMSS context questionnaire scale was established in 2011 based on the combined response distribution of countries that participated in TIMSS 2011. To provide a point of reference for country comparisons, the scale centerpoint of 10 was located at the mean of the combined distribution. The units of the scale were chosen so that 2 scale score points corresponded to the standard deviation of the distribution.
( ) Standard errors appear in parentheses. Because of rounding some results may appear inconsistent.
An “r” indicates data are available for at least 70% but less than 85% of the students.
An “s” indicates data are available for at least 50% but less than 70% of the students.
An “x” indicates data are available for at least 40% but less than 50% of the students—interpret with caution.
A tilde (~) indicates insufficient data to report result.
Scroll Up