Home Environment
Early Literacy and Numeracy Tasks Before Primary School
Students who are able to do basic literacy and numeracy tasks when they begin primary school tend to have higher fourth-grade mathematics and science achievement than those who are not. The TIMSS 2023 Literacy and Numeracy Tasks scale (Exhibit 3.2.4) classifies students based on their parents’ reports of how well they could do various literacy and numeracy activities when they began primary school. Students were classified as doing the tasks “very well,” “moderately well,” or “not well.”
On average across countries, 23 percent of students entered school able to do early literacy and numeracy tasks “very well,” 52 percent were able to do the tasks “moderately well,” and 25 percent could do the tasks “not well.” There is considerable variation in these percentages across countries.
Exhibit 3.2.5 shows the relationship between students’ ability to do early literacy and numeracy tasks when beginning primary school and their mathematics achievement. Internationally, students who were able to perform early literacy and numeracy tasks “very well” when beginning primary school had an average mathematics achievement of 536, which is higher than the average mathematics achievement of students who could do the tasks “moderately well” (503) or “not well” (473). A similar pattern is observed for science in Exhibit 3.2.6, where students who could do the tasks “very well” had an average achievement of 520, students who could do the tasks “moderately well” had an average achievement of 492, and students who could do the tasks “not well” had an average achievement of 465.
Read More
Early Literacy and Numeracy Tasks Before Primary School – Parents’ Reports

Higher Socioeconomic Status
Middle Socioeconomic Status
Lower Socioeconomic Status
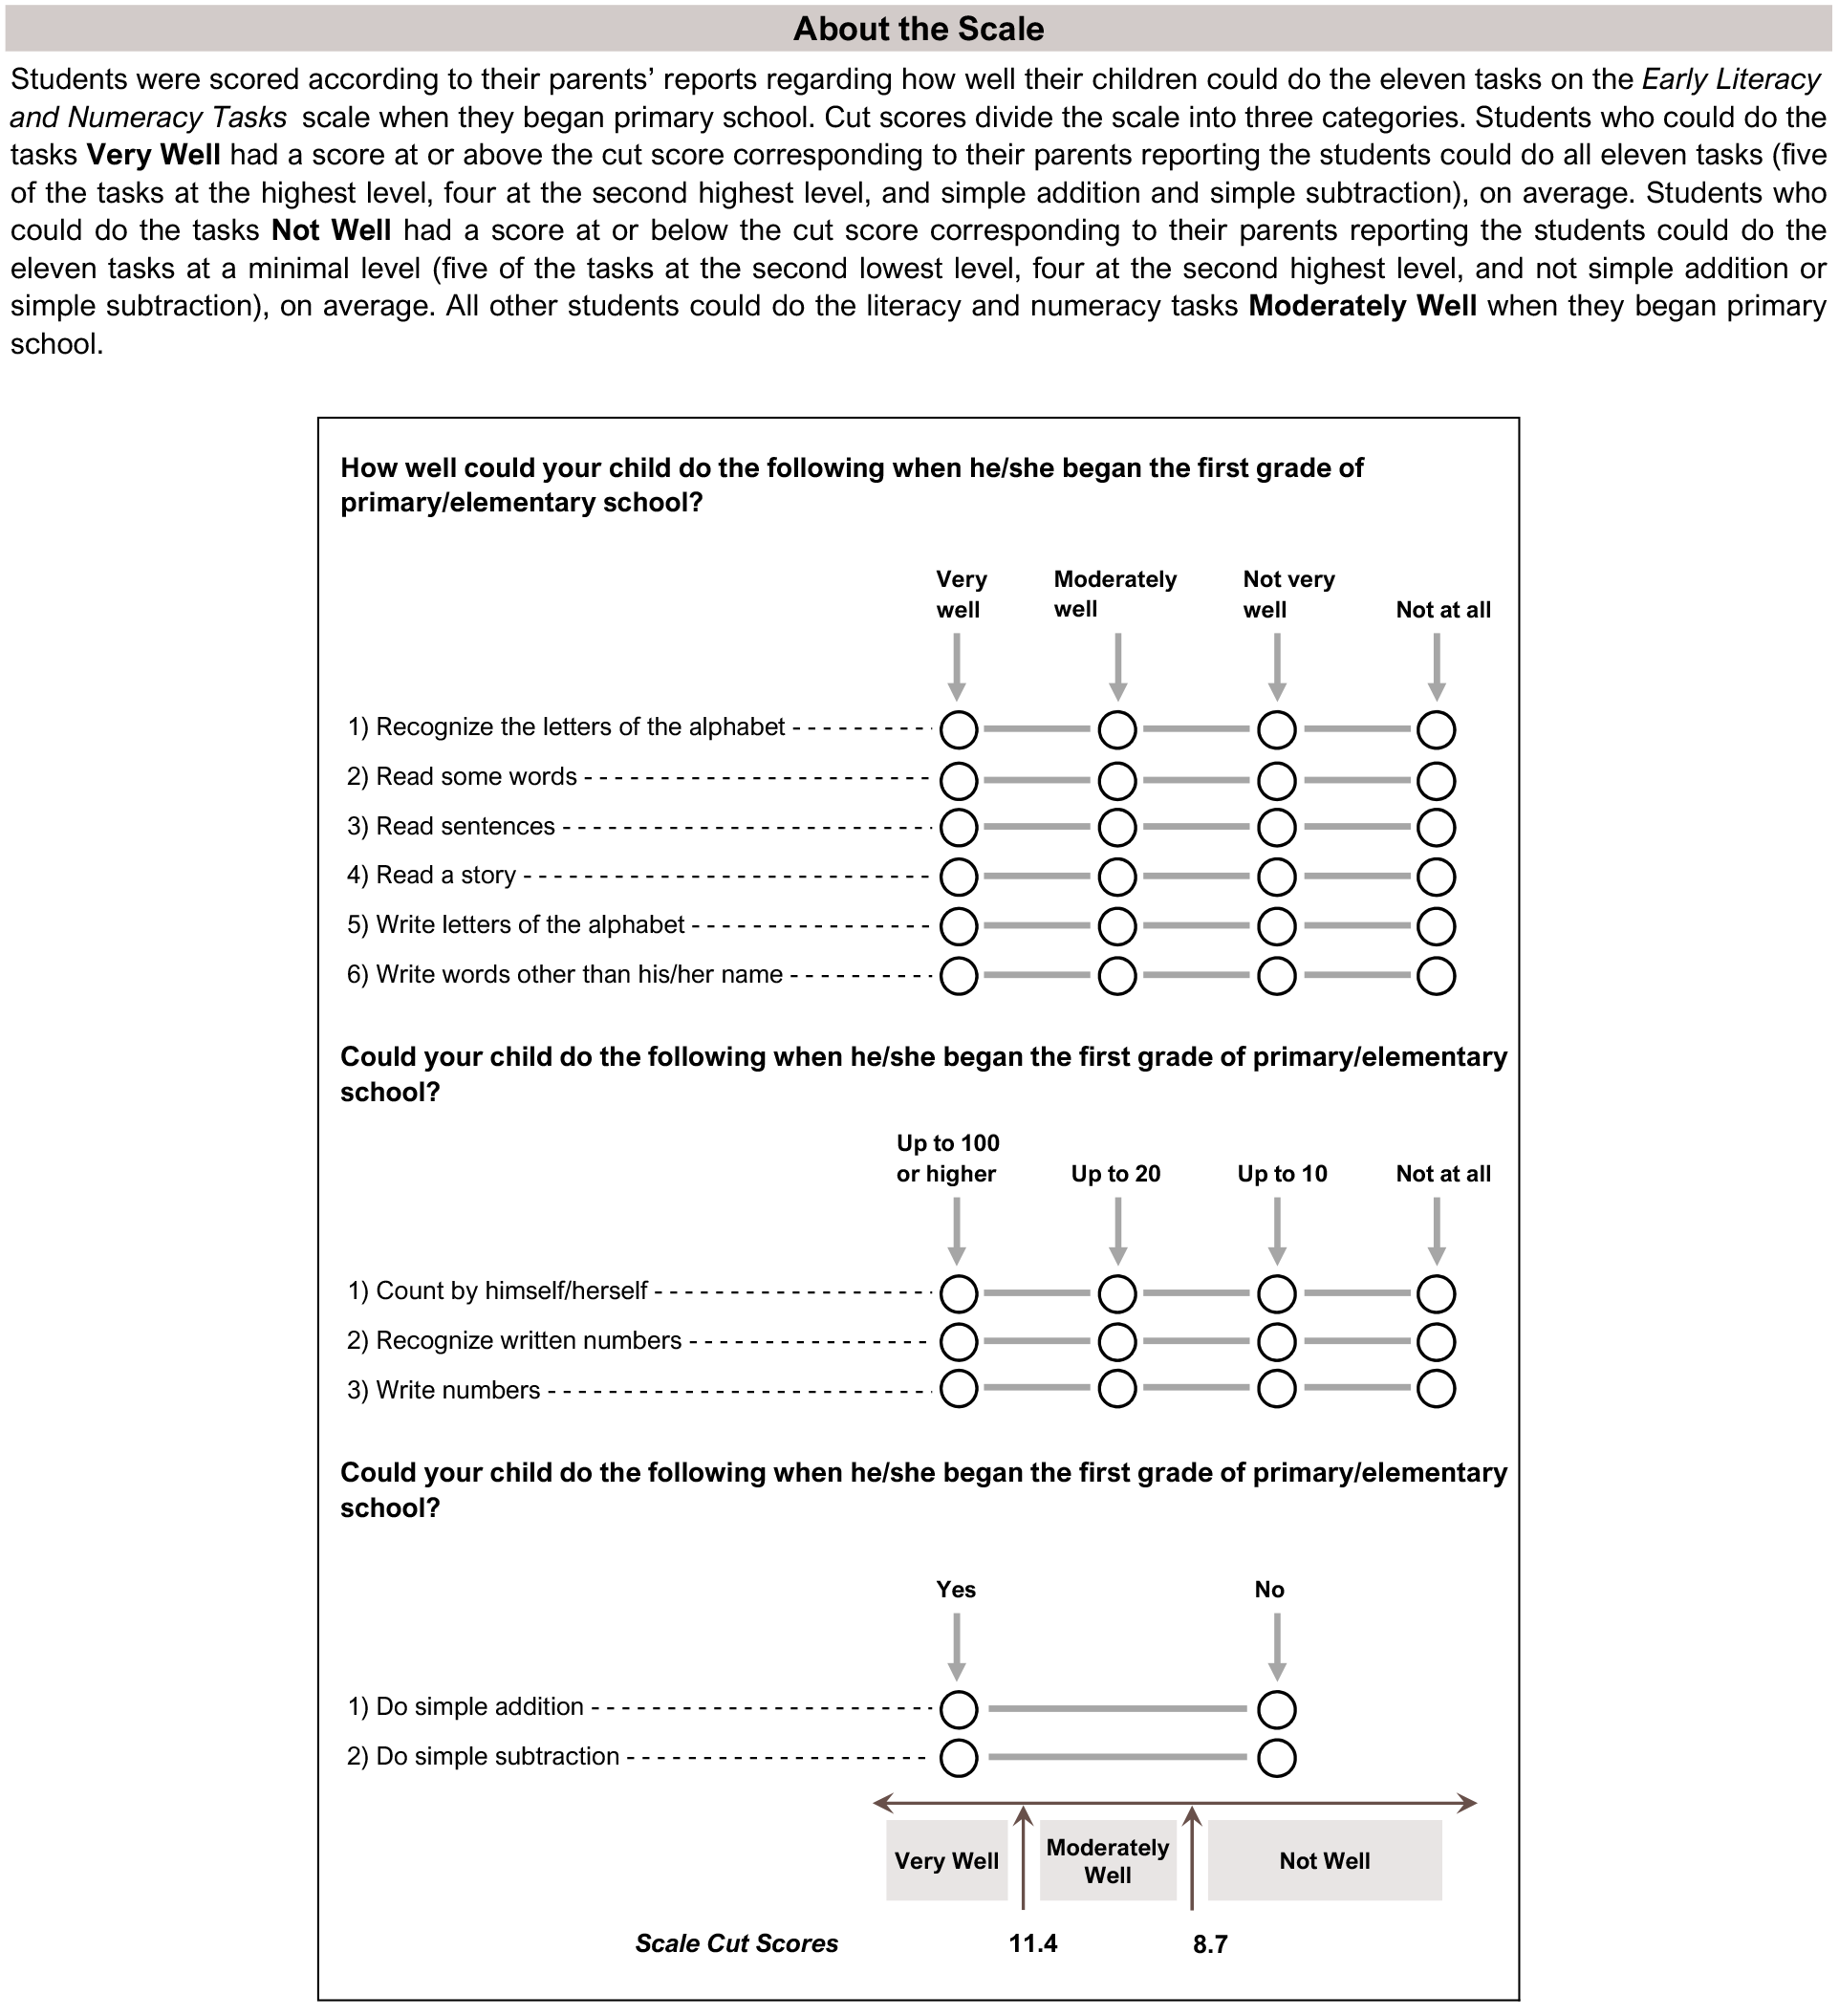
This TIMSS context questionnaire scale was established in 2015 based on the combined response distribution of countries that participated in TIMSS 2015. To provide a point of reference for country comparisons, the scale centerpoint of 10 was located at the mean of the combined distribution. The units of the scale were chosen so that 2 scale score points corresponded to the standard deviation of the distribution.
( ) Standard errors appear in parentheses. Because of rounding some results may appear inconsistent.
An “r” indicates data are available for at least 70% but less than 85% of the students.
An “s” indicates data are available for at least 50% but less than 70% of the students.
An “x” indicates data are available for at least 40% but less than 50% of the students—interpret with caution.
A “y” indicates data are available for less than 40% of the students.
A dash (-) indicates comparable data not available.
Scroll Up