Home Environment
Home Early Literacy and Numeracy Activities Before Primary School
Engagement in educational activities before primary school has a modest positive relationship with fourth-grade students’ mathematics and science achievement. The TIMSS 2023 Early Literacy and Numeracy Activities scale (Exhibit 3.2.1) focuses specifically on literacy and numeracy activities and summarizes parents’ reports about how often they engaged with their child in eight literacy activities and eight numeracy activities before their child began primary school. Based on these responses, students were classified as engaging in these types of activities “very often,” “often,” or “sometimes” before beginning primary school.
A small majority (53%, on average) of students’ parents “often” engaged them in early literacy and numeracy activities before primary school. Twenty-one percent of students’ parents engaged them in these activities “very often,” and 26 percent of students’ parents “sometimes” engaged them in these activities.
Exhibits 3.2.2 and 3.2.3 show the relationship between engagement in early literacy and numeracy activities and mathematics or science achievement. Students whose parents “very often” engaged them in these activities had the highest average achievement internationally in both mathematics and science (523 and 513, respectively), while students whose parents “sometimes” engaged them in these activities had the lowest average achievement internationally in both subjects (487 in mathematics and 475 in science). Average achievement for students whose parents “often” engaged them in these activities was in between for both subjects (507 in mathematics and 496 in science, internationally).
Read More
Home Early Literacy and Numeracy Activities Before Primary School – Parents’ Reports

Higher Socioeconomic Status
Middle Socioeconomic Status
Lower Socioeconomic Status
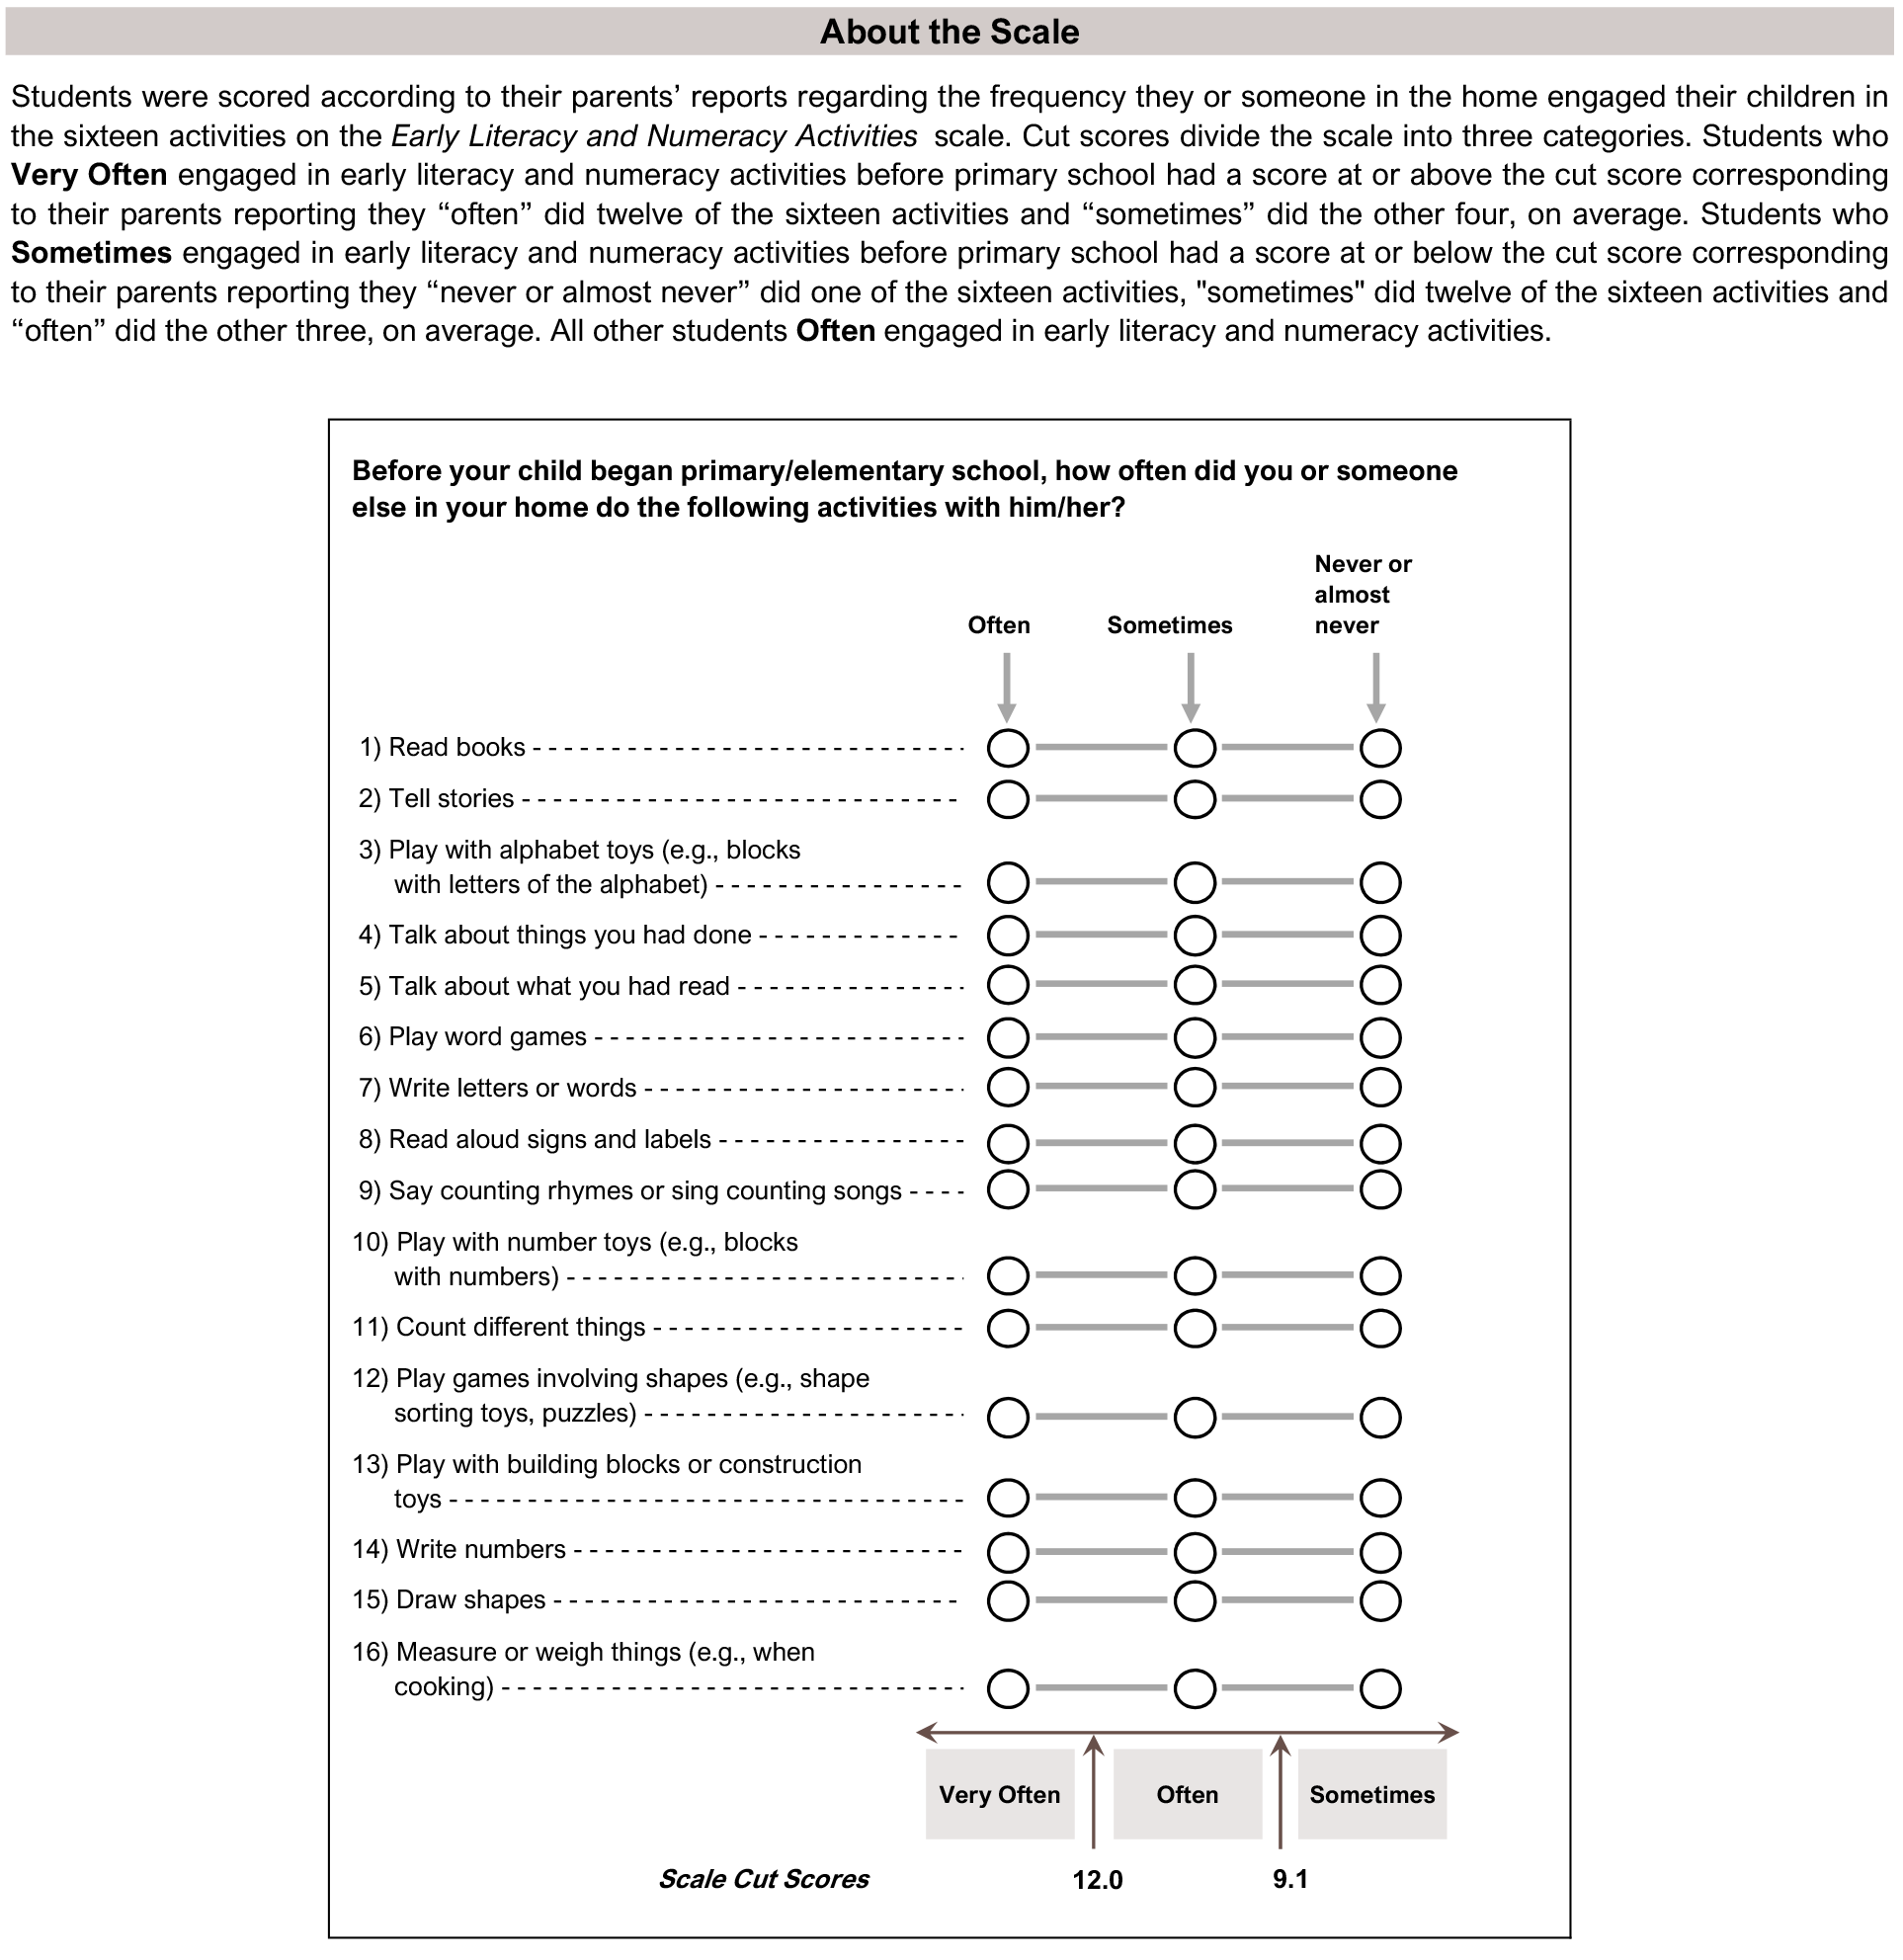
This TIMSS context questionnaire scale was established in 2011 based on the combined response distribution of countries that participated in TIMSS 2011. To provide a point of reference for country comparisons, the scale centerpoint of 10 was located at the mean of the combined distribution. The units of the scale were chosen so that 2 scale score points corresponded to the standard deviation of the distribution.
( ) Standard errors appear in parentheses. Because of rounding some results may appear inconsistent.
An “r” indicates data are available for at least 70% but less than 85% of the students.
An “s” indicates data are available for at least 50% but less than 70% of the students.
An “x” indicates data are available for at least 40% but less than 50% of the students—interpret with caution.
A “y” indicates data are available for less than 40% of the students.
A dash (-) indicates comparable data not available.
Scroll Up