Home Environment
Home Socioeconomic Status
Home socioeconomic status has a strong relationship with fourth-grade students’ achievement in mathematics and science. Higher socioeconomic status is associated with greater average achievement. The TIMSS 2023 Home Socioeconomic Status scale (Exhibit 3.1.1) is based on parents’ reports about the number of books and children’s books in the home, as well as self-reported parental education level and occupation. Based on these reports, students were classified as “higher,” “middle,” or “lower,” socioeconomic status.
On average internationally, 30% of students were classified in the “higher” home socioeconomic status category, 48% were classified in the “middle” home socioeconomic status category, and 22% were classified in the “lower” home socioeconomic status category. These percentages varied widely across countries.
There are relatively large achievement differences across the three groups for both mathematics and science. Average achievement differences are particularly large between the “higher” and “lower” home socioeconomic status groups (85 points in mathematics and 91 points in science). In mathematics (Exhibit 3.1.2), students classified as “higher” home socioeconomic status had an average achievement of 544, students classified as “middle” home socioeconomic status had an average achievement of 502, and students classified as “lower” home socioeconomic status had an average achievement of 459. There is a similar pattern in science achievement (Exhibit 3.1.3): students classified as “higher” home socioeconomic status had an average achievement of 535, students classified as “middle” home socioeconomic status had an average achievement of 490, and students classified as “lower” home socioeconomic status had an average achievement of 444.
Read More
Home Socioeconomic Status – Parents’ Reports

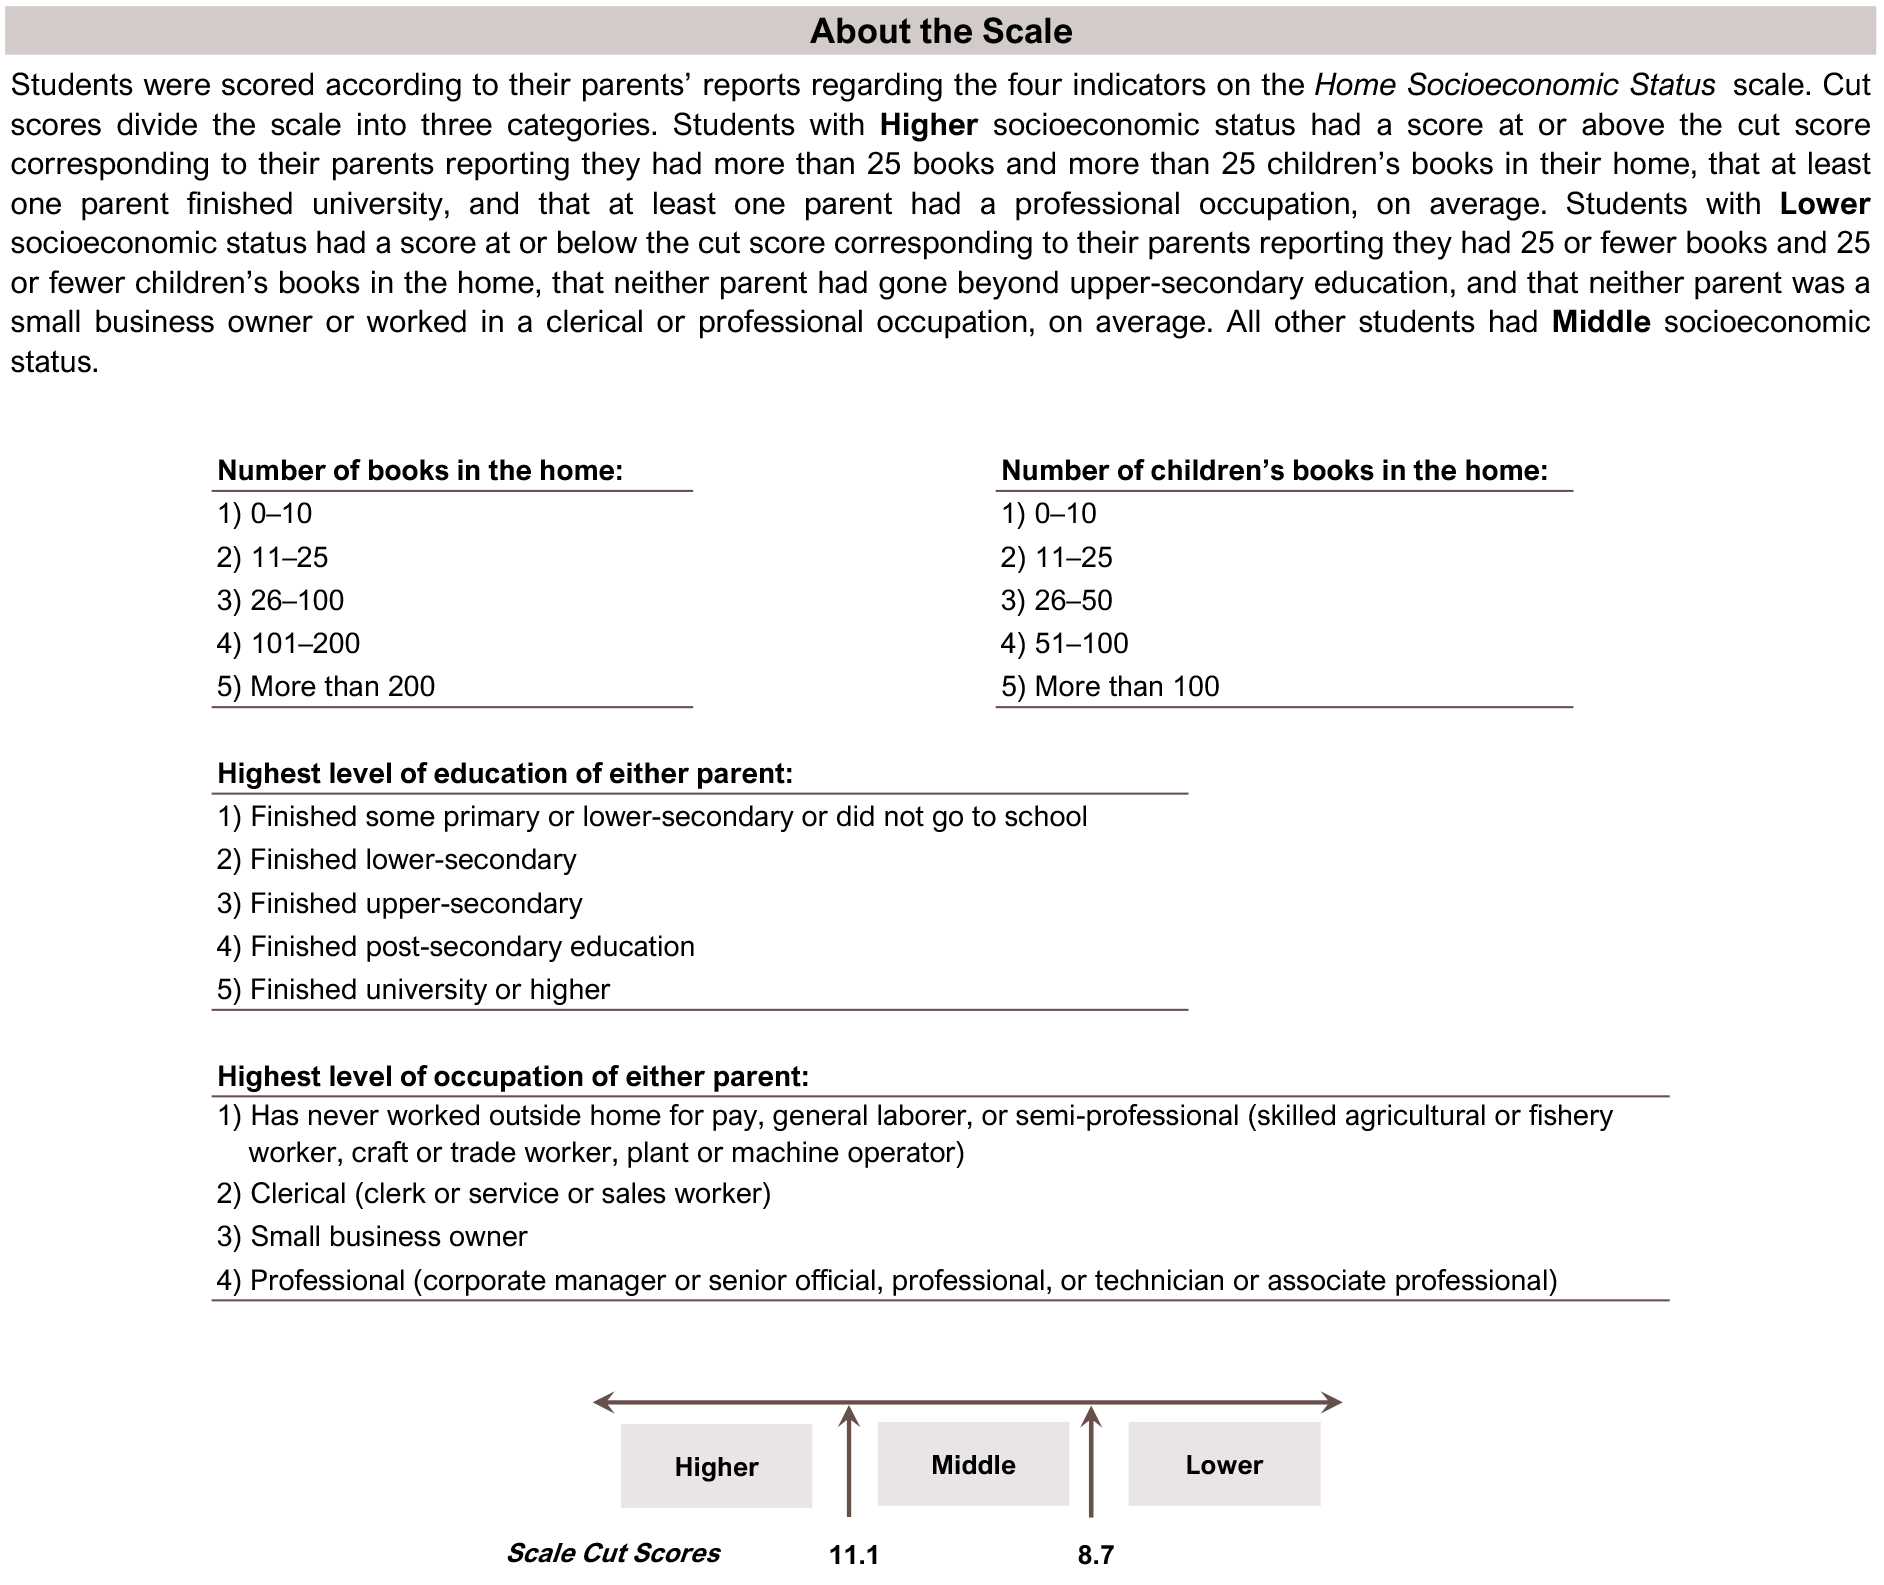
This TIMSS context questionnaire scale was established in 2019 based on the combined response distribution of countries that participated in TIMSS 2019. To provide a point of reference for country comparisons, the scale centerpoint of 10 was located at the mean of the combined distribution. The units of the scale were chosen so that 2 scale score points corresponded to the standard deviation of the distribution.
( ) Standard errors appear in parentheses. Because of rounding some results may appear inconsistent.
An “r” indicates data are available for at least 70% but less than 85% of the students.
An “s” indicates data are available for at least 50% but less than 70% of the students.
An “x” indicates data are available for at least 40% but less than 50% of the students—interpret with caution.
A “y” indicates data are available for less than 40% of the students.
A dash (-) indicates comparable data not available.
Scroll Up