Trends in Distributions of Students Reaching the TIMSS International Benchmarks of Science Achievement
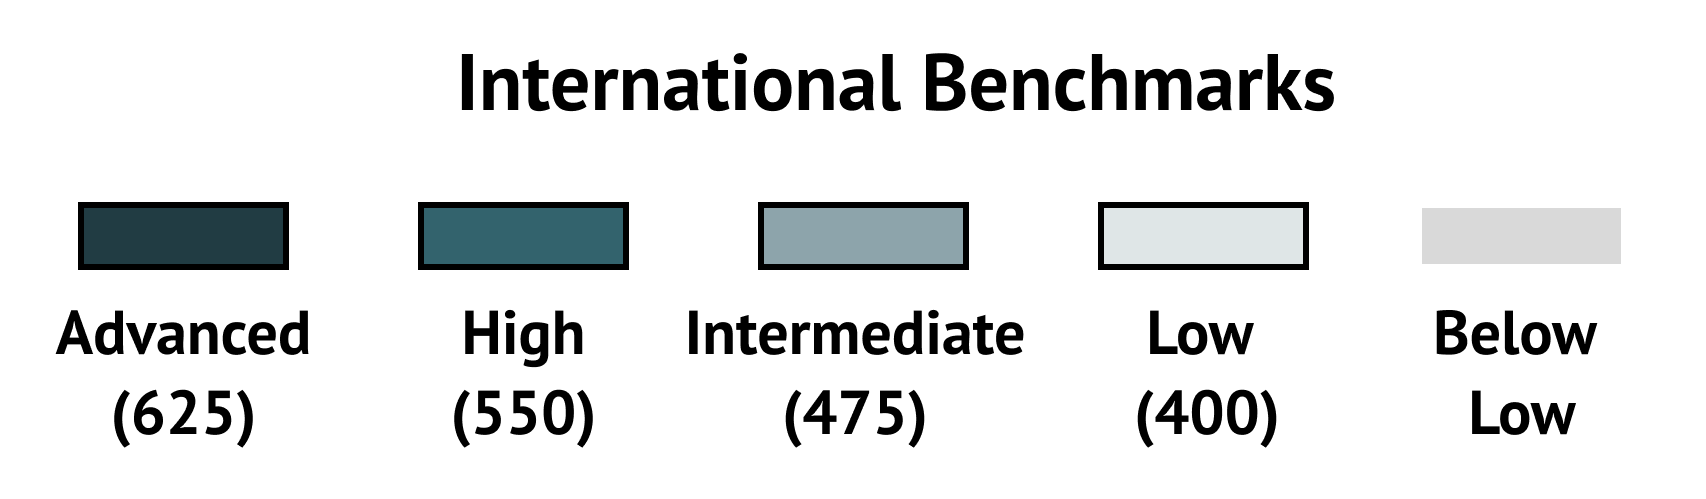
Exhibit 2.2.12 provides bar graphs for each country and benchmarking participant with comparable data from previous TIMSS assessments, presenting the distribution of students at the TIMSS International Benchmarks with a bar for each cycle from 1995 to 2023. Each bar displays the percentage of students reaching each of the International Benchmarks for a given assessment cycle. The shading of the bar segments ranges from dark to light green, and each lighter colored segment indicates the cumulative percentage of students that reached the less demanding benchmarks. Few students in most countries reach the Advanced Benchmark (darkest green segment); more students reach the High Benchmark (dark green plus medium green segments); even more students reach the Intermediate Benchmark (indicated by three darker segments); finally, in most countries, a large majority of students reaches the Low Benchmark (all shades of green combined). The gray area indicates the percentage of students that did not reach the Low International Benchmark (i.e., were “below low”). The achievement of these students cannot be characterized by any of the TIMSS 2023 International Benchmarks.
Students reaching the Intermediate, High, and Advanced International Benchmarks demonstrated all the science skills at their level but also those displayed by the students at the lower levels. Long-term increases in the percentages of students reaching the Low and Intermediate Benchmarks provide an indication that more students over time demonstrate a basic level of science proficiency.
The short-term trends between TIMSS 2019 and TIMSS 2023 show more decreases than increases in percentages of students reaching the International Benchmarks, especially at the lower end of the scale. Of the 34 countries that participated in both 2019 and 2023 with comparable data, 5 increased and 7 decreased at the Advanced International Benchmark, 2 increased and 14 decreased at the High Benchmark, 1 increased and 19 decreased at the Intermediate Benchmark, and 2 increased and 19 decreased at the Low Benchmark.
Read More
Exhibit 2.2.12: Trends in Distributions of Students Reaching the TIMSS International Benchmarks of Science Achievements
Science Grade 8
See Appendix A for country participation in previous TIMSS assessments.
New Zealand did not satisfy guidelines for minimum school participation in 2023.
Suggested Citation
von Davier, M., Kennedy, A., Reynolds, K., Fishbein, B., Khorramdel, L., Aldrich, C., Bookbinder, A., Bezirhan, U., & Yin, L. (2024). TIMSS 2023 International Results in Mathematics and Science. Boston College, TIMSS & PIRLS International Study Center. https://doi.org/10.6017/lse.tpisc.timss.rs6460