Disorderly Behavior Math
Classroom Environment
Disorderly Behavior During Mathematics Lessons
Students’ reports of disorderly behavior during mathematics classes have a negative relationship with average mathematics achievement. The TIMSS 2023 Disorderly Behavior During Mathematics Lessons scale (Exhibit 5.2.4) includes items that asked students to report the frequency with which students engaged in disruptive behaviors during mathematics lessons. Based on their responses, students were assigned into one of three categories on the scale: experiencing disorderly behavior during “few or no lessons,” “some lessons,” or “most lessons.” Higher scale scores indicate less disruption than lower scale scores.
In fourth grade, the majority of students (65%) reported disorderly behavior in “some lessons,” on average, with slightly less than 20 percent of students reporting disorderly behavior in “most lessons” (19%). Fewer students in fourth grade reported disruption in “few or no lessons” (16%). Internationally and in many countries, there was a clear negative association between the frequency of disorderly behavior and average mathematics achievement in the fourth grade, with average achievement decreasing with higher frequencies of disorderly behavior (Exhibit 5.2.5). Students who reported experiencing disorderly behavior in “most lessons” had the lowest average mathematics achievement (486) compared to those who reported disruption only in “some lessons” (507) or “few or no lessons” (514).
A majority of eighth-grade students internationally reported disorderly behavior in “some lessons” (61%) and 17 percent of students reported disorderly behavior in “most lessons,” on average. Twenty-two percent of eighth-grade students reported disorderly behavior in “few or no lessons.” A negative relationship between average mathematics achievement and increased disorder was observed internationally in the eighth grade (Exhibit 5.2.6). Students who reported experiencing disorderly behavior in “most lessons” had the lowest average mathematics achievement (456) compared to those who reported disruption only in “some lessons” (473) or “few or no lessons” (486).
Read More
Disorderly Behavior During Mathematics Lessons

Few or No Lessons
Some Lessons
Most Lessons
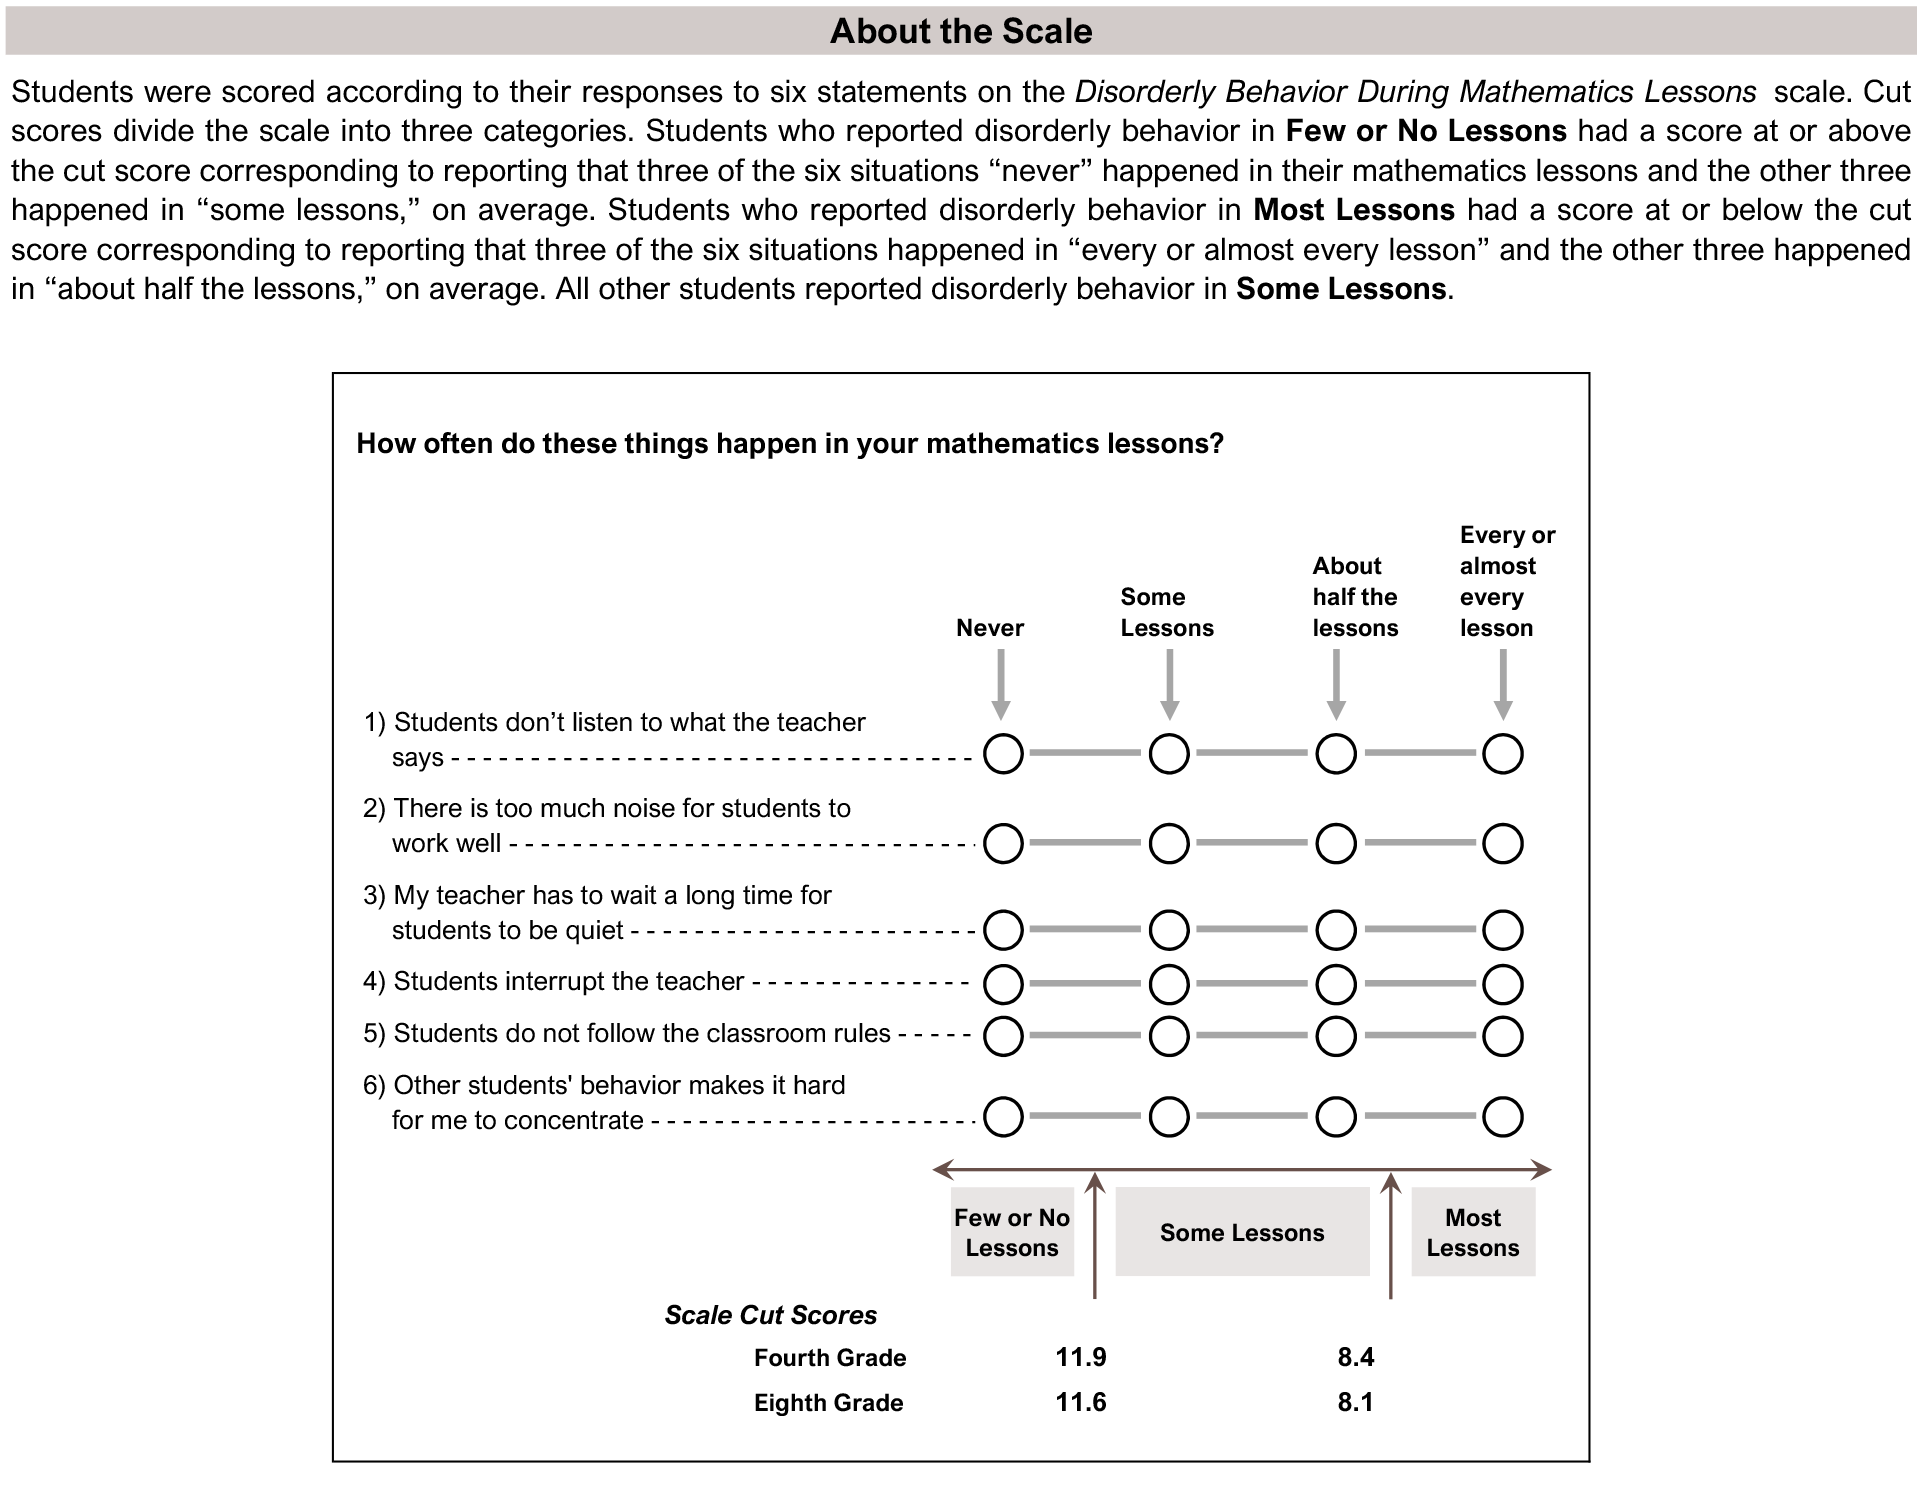
This TIMSS context questionnaire scale was established in 2023 based on the combined response distribution of countries that participated in TIMSS 2023. To provide a point of reference for country comparisons, the scale centerpoint of 10 was located at the mean of the combined distribution. The units of the scale were chosen so that 2 scale score points corresponded to the standard deviation of the distribution.
( ) Standard errors appear in parentheses. Because of rounding some results may appear inconsistent.
An “r” indicates data are available for at least 70% but less than 85% of the students.
A dash (-) indicates comparable data not available.
A tilde (~) indicates insufficient data to report result.
Scroll Up