Students Like Learning Science
Student Experiences and Attitudes
Students Like Learning Science
Students who enjoy learning science tend to have higher average science achievement in both fourth and eighth grades. In the TIMSS 2023 Students Like Learning Science scale items (Exhibit 6.3.1), students were asked to report the extent of their agreement with seven statements about attitudes toward studying science. In countries where eighth-grade students study separate science subjects, students responded to the items for each subject in which they were enrolled (biology, chemistry, physics, earth science). Based on their responses, students were classified in one of three categories: “very much like” learning science, “somewhat” like learning science, or “do not like” learning science.
Exhibit 6.3.2 shows the results for the fourth grade. On average, internationally, about half of fourth-grade students reported that they “very much like” learning science (53%). Twenty-nine percent of fourth-grade students reported that they “somewhat like” learning science and 18 percent reported that they “do not like” learning science. In seven countries, 30 percent or more of students reported that they “do not like” learning science. In another 10 countries, less than 10 percent of students were in this category. For fourth-grade students internationally, there was a 22-point difference in average science achievement between students who “very much like” learning science and students who “do not like” learning science (504 vs. 482).
Results for eighth grade are presented for integrated science (Exhibit 6.3.3a) and for the separate science subjects (Exhibits 6.3.3b to 6.3.3e). Internationally and across science subjects, less than half of eighth-grade students reported that they “very much like” learning science. In integrated science, on average, 40 percent of students indicated that they “very much like” learning science, another 34 percent indicated that they “somewhat like” learning science, and 26 percent of students indicated that they “do not like” learning science. Students enrolled in separate science subjects were even less positive, with percentages in the “very much like” category ranging from 30 to 35 percent, on average. The difference in average science achievement between students who reported that they “very much like” learning science and students who reported that they “do not like” learning science is largest for eighth-grade students enrolled in integrated science, where there is a 43-point difference in average science achievement between students who “very much like” and “do not like” learning science (504 vs. 461). The difference in average achievement between eighth-grade students who reported that they “very much like” and reported that they “do not like” learning separate science subjects was smaller and varied across the four subjects—12 points for biology, 22 points for chemistry, 25 points for physics, and just 8 points for earth science.
Read More
Students Like Learning Science
Very Much Like
Somewhat Like
Do Not Like
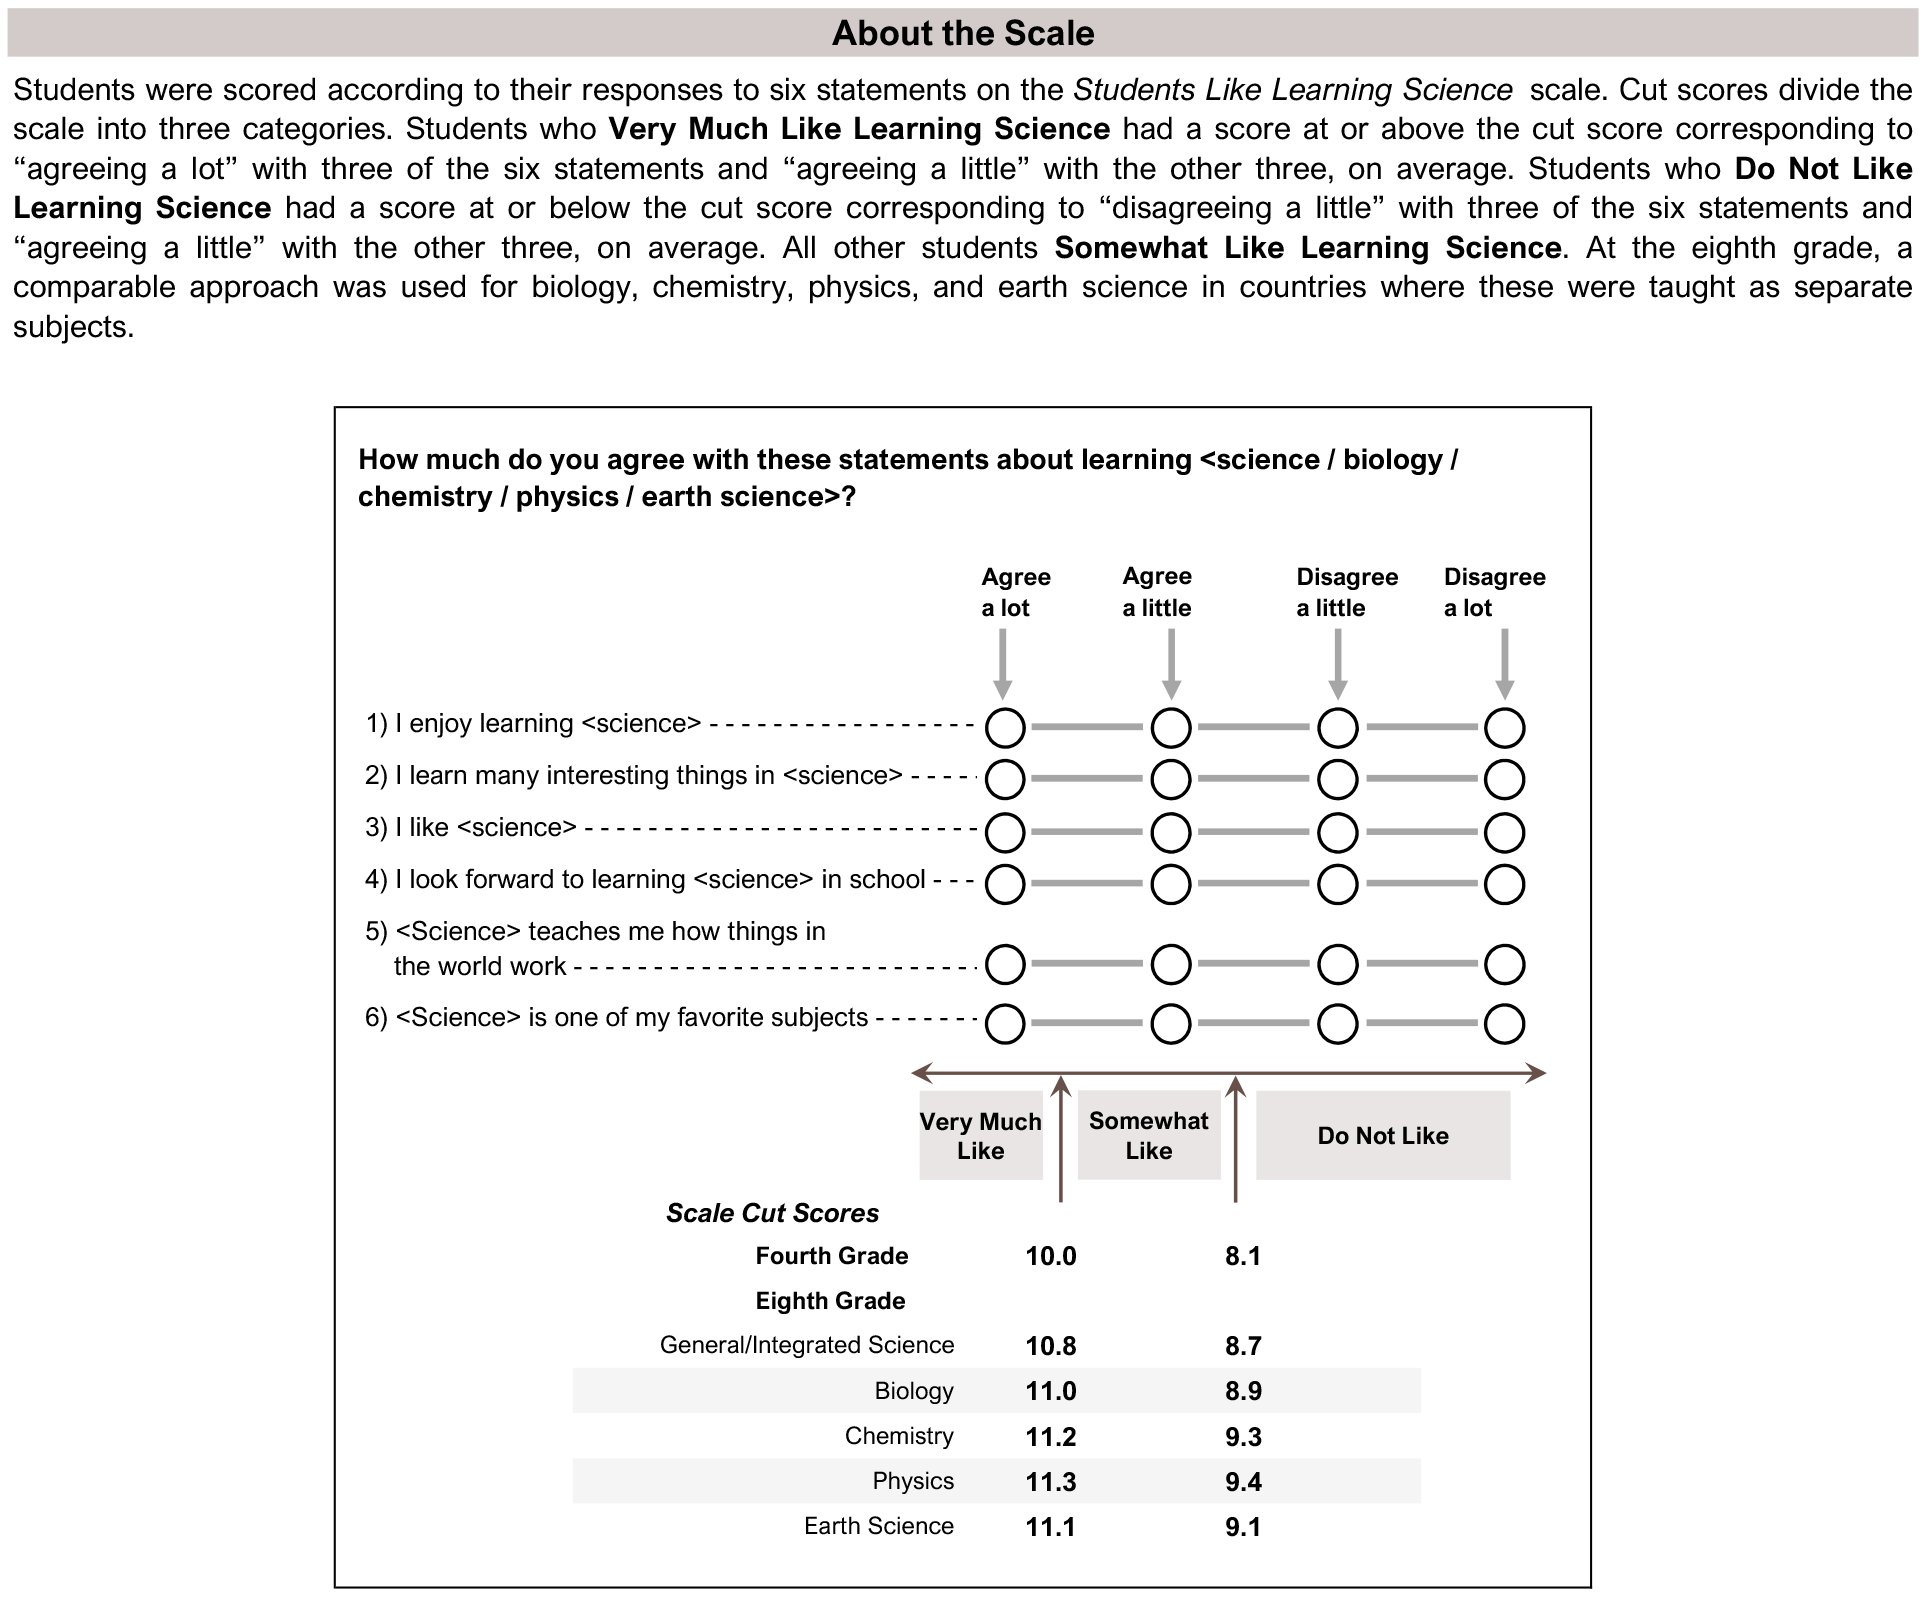
This TIMSS context questionnaire scale was established in 2023 based on the combined response distribution of countries that participated in TIMSS 2023. To provide a point of reference for country comparisons, the scale centerpoint of 10 was located at the mean of the combined distribution. The units of the scale were chosen so that 2 scale score points corresponded to the standard deviation of the distribution. The separate scales for biology, chemistry, physics, and earth science were each established in 2023 using a comparable approach.
( ) Standard errors appear in parentheses. Because of rounding some results may appear inconsistent.
An “r” indicates data are available for at least 70% but less than 85% of the students.
An “x” indicates data are available for at least 40% but less than 50% of the students—interpret with caution.
A “y” indicates data are available for less than 40% of the students.
A dash (-) indicates comparable data not available.
Average achievement in exhibits 6.3.3a – 6.3.3e is overall science achievement.
Scroll Up