Student Bullying
Student Experiences and Attitudes
Student Bullying (Grade 8)
There is a strong negative relationship between frequent experience of bullying behaviors and average achievement in mathematics and science for eighth-grade students. Even reporting occasional experiences of bullying is associated with lower average achievement, but to a lesser degree than reporting frequent experiences of bullying. The TIMSS 2023 eighth-grade Student Bullying scale (Exhibit 6.1.9) classified students based on their reports of how frequently they experienced different forms of bullying within the past school year. Students were classified as reporting being bullied “never or almost never,” “about monthly,” or “about weekly.”
On average, more than half of eighth-grade students were classified as “never or almost never” being bullied (60%). Twenty-seven percent of students were classified as being bullied “about monthly” and the remaining 13 percent of students were classified as being bullied “about weekly.” Although there is variation across individual countries, 50 percent or more of eighth-grade students in most countries were classified as being bullied “never or almost never.” Eight countries had 20 percent or more of students classified as being bullied “about weekly” and 16 countries had less than 10 percent of students in this category.
Average achievement for students in each of the scale categories is presented in Exhibits 6.1.10 and 6.1.11 for mathematics and science, respectively. Students classified as being bullied “never or almost never” had the highest average achievement in both mathematics and science (487 and 488, respectively). Students classified as being bullied “about weekly” had much lower average achievement in both subjects (429 for mathematics and 420 for science). Average achievement for students classified as being bullied “about monthly” was in between: 472 for mathematics and 471 for science.
Read More
Student Bullying

Never or Almost Never
About Monthly
About Weekly
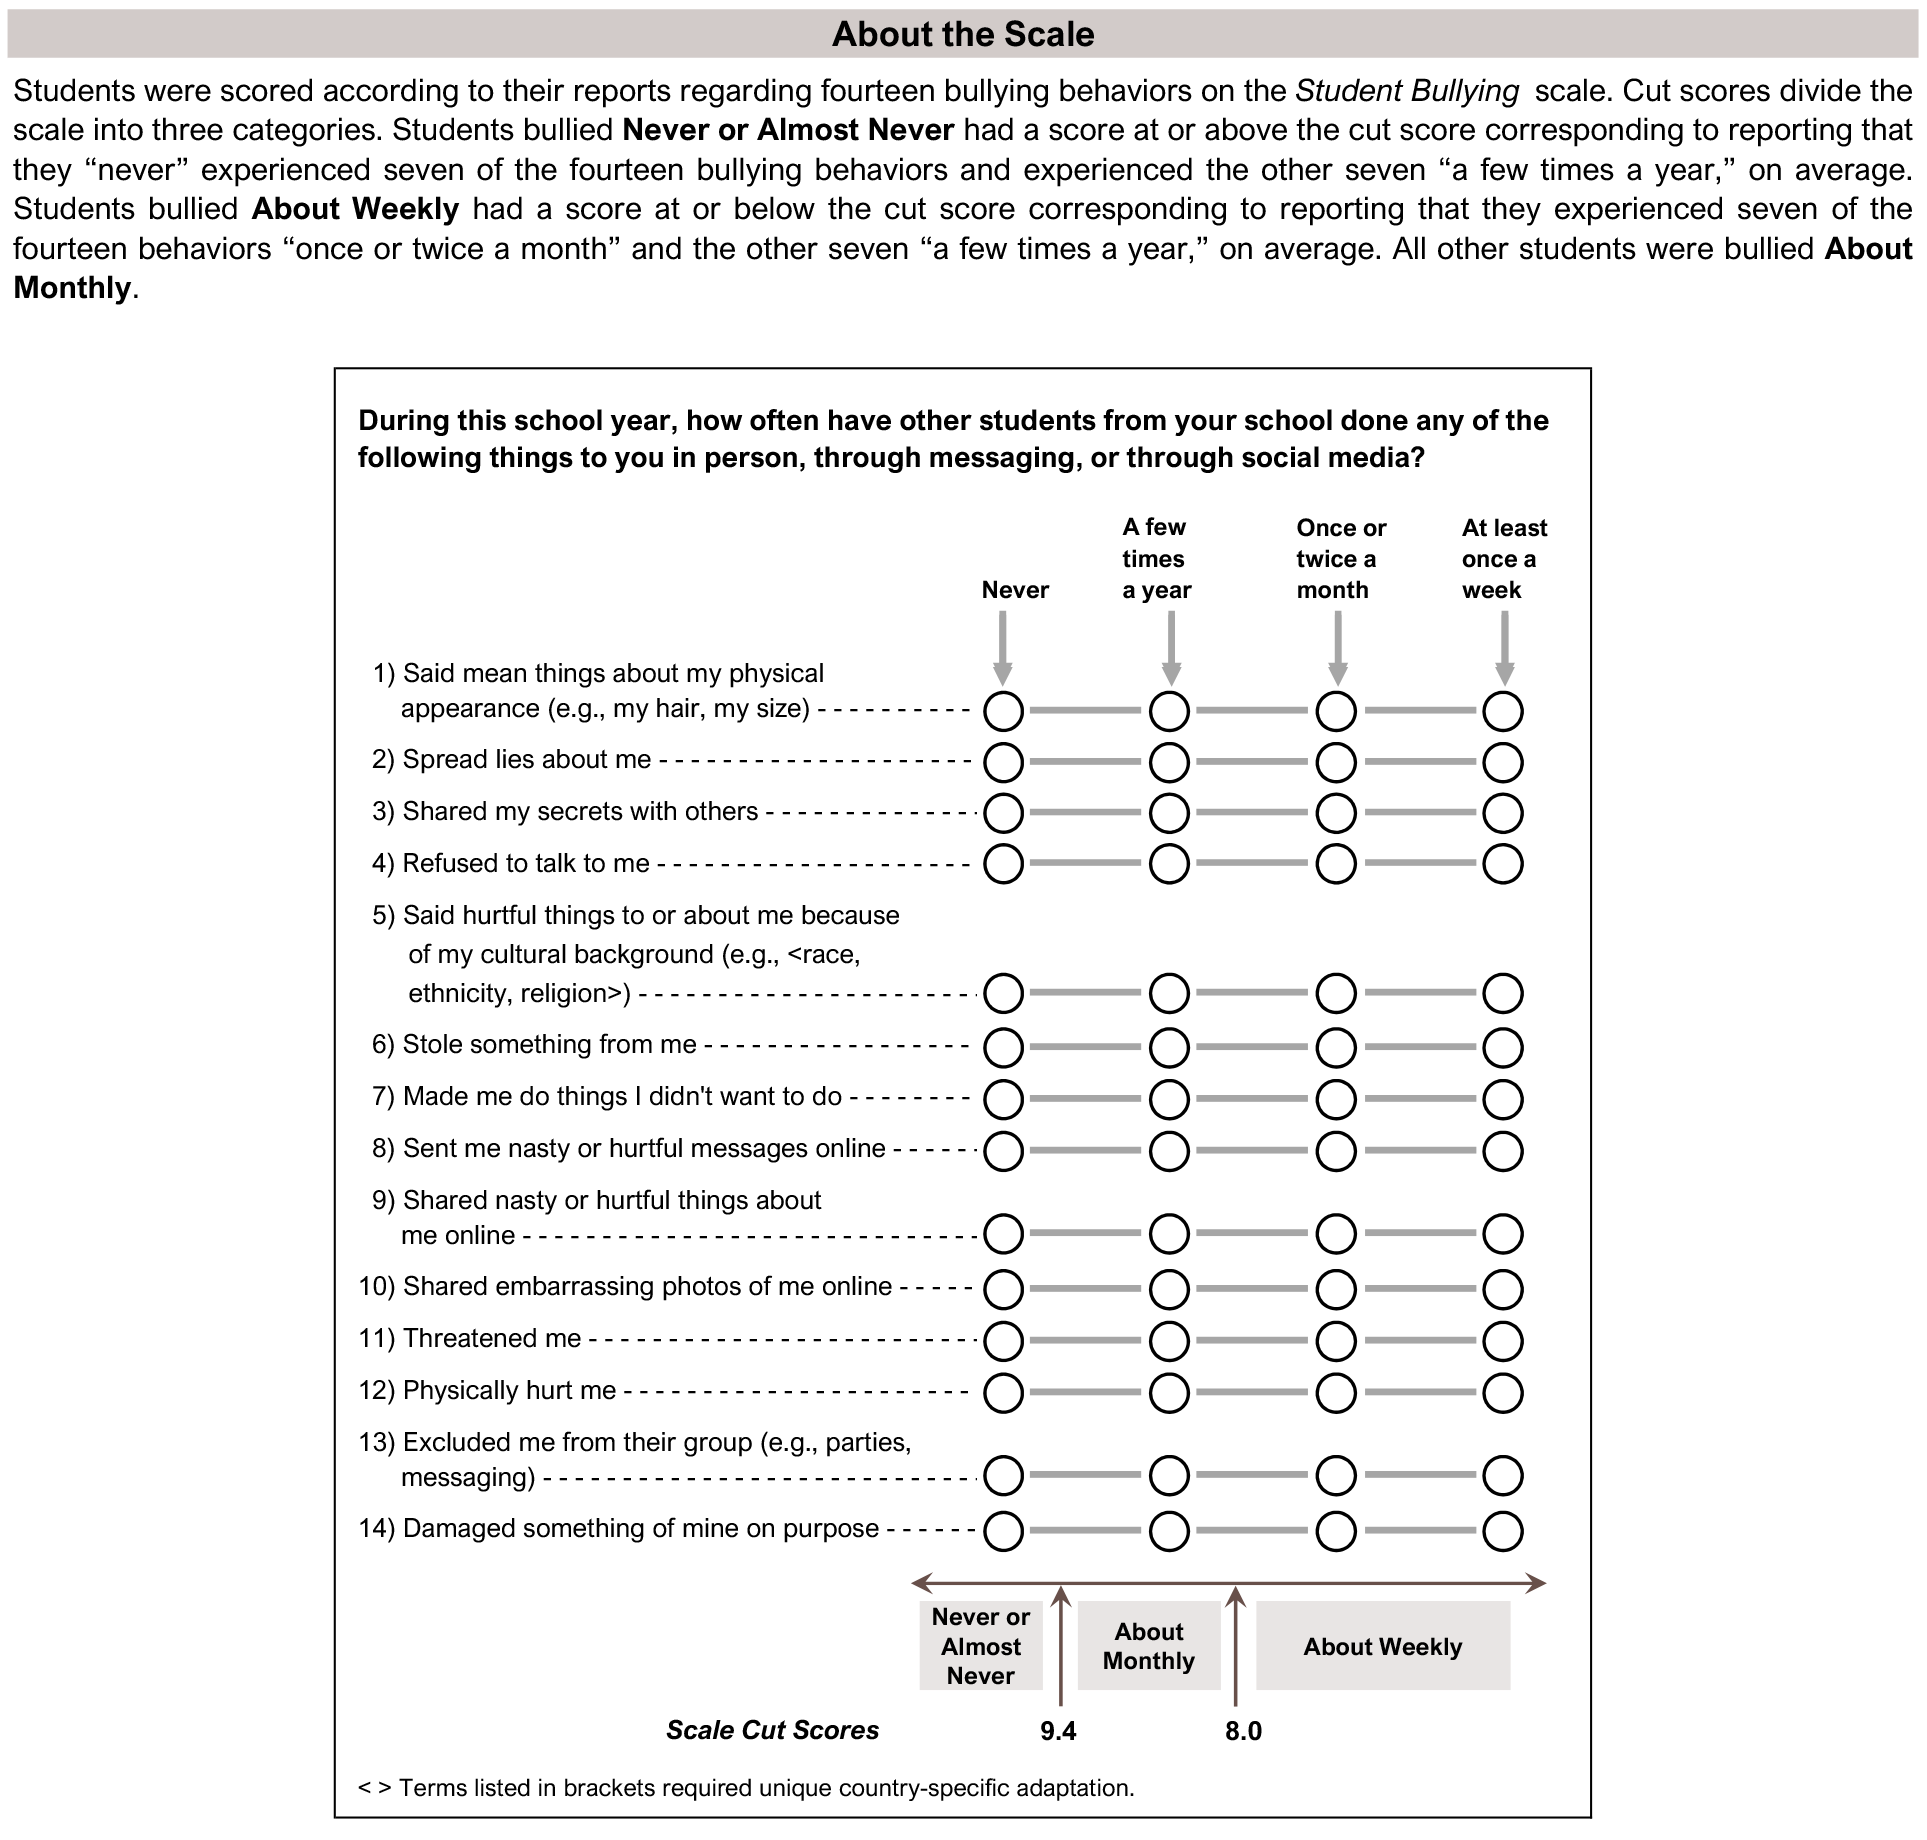
This TIMSS context questionnaire scale was established in 2023 based on the combined response distribution of countries that participated in TIMSS 2023. To provide a point of reference for country comparisons, the scale centerpoint of 10 was located at the mean of the combined distribution. The units of the scale were chosen so that 2 scale score points corresponded to the standard deviation of the distribution.
( ) Standard errors appear in parentheses. Because of rounding some results may appear inconsistent.
A dash (-) indicates comparable data not available.
A tilde (~) indicates insufficient data to report result.
Scroll Up